Figures & data
Figure 1 Process flowchart for research analysis.
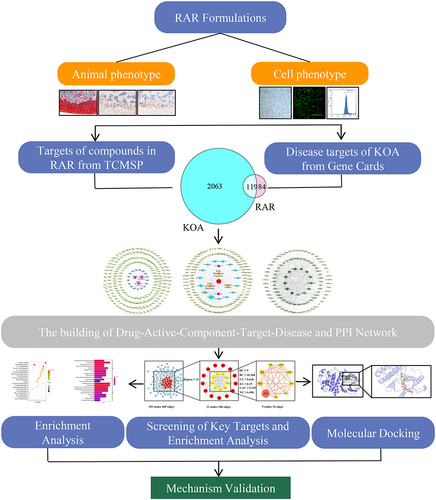
Table 1 Primer Sequences
Figure 2 RAR ameliorates abnormal gait and swelling in OA rats. (A) Curve showing the degree of swelling of the right knee joint in the rats. (B) Rat gait imprint. (C) Changes in hind paw stride length of the rats. (D–G) Analysis of the paw area (mm3), paw weight (%), and exposure duration (s). All data are presented as the means ± standard deviations (n=10). Sham vs DMM, ###P < 0.001; DMM vs RAR/PC, *P <0.05, **P <0.01, ***P <0.001.
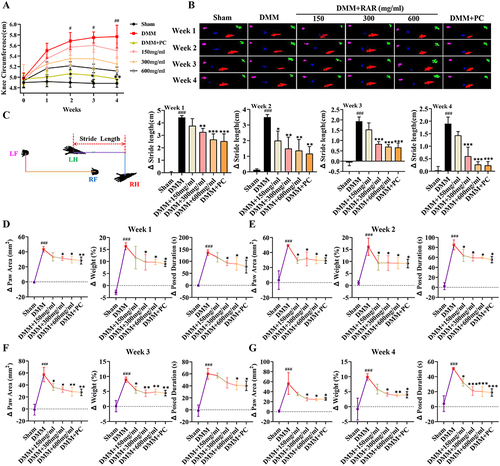
Figure 3 RAR decelerated cartilage degeneration and enhanced ECM anabolism in OA rats. (A) Rat knee joints scanned in 3D after RAR and PC therapy at several doses using Micro-CT. The red arrows indicate surface irregularities and cracks in the knee joints. (B–D) BV/TV, Tb.Th, and Tb.Sp quantitative analysis. (E) Rats’ right knee joint stained with safranin-O-solid green (S&F). Col2a1 and Acan in cartilage stained with IHC. Scale bar=200 μm. (F) OARSI score of the tibial plateau. (G and H) Quantification of the percentage of positive expression of Col2a1 (%) and Acan (%). (I) Relative mRNA expression of Acan, Comp, and Col2a1 in DMM rats treated with RAR and PC. All data are presented as the means ± standard deviations (n=10). Sham vs DMM, ###P < 0.001; DMM vs RAR/PC, *P <0.05, **P <0.01, ***P <0.001.
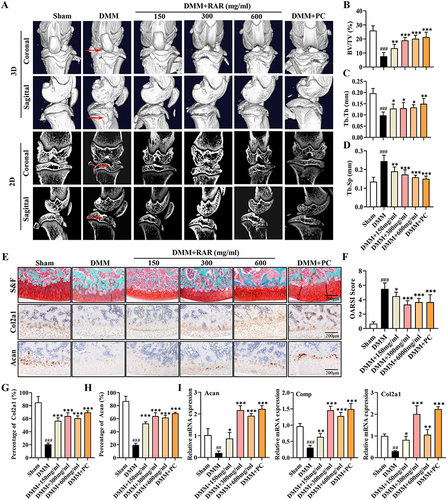
Figure 4 RAR promotes chondrocyte anabolism and inhibits oxidative stress in vitro. (A) CCK-8 was used to measure cell proliferation following 24, 48, and 72 h of RAR treatment. (B) Alcian blue staining was used to detect acidic polysaccharides at various RAR concentrations. (C) Acan, Comp, and Col2a1 relative mRNA expression in IL-1β-induced primary chondrocytes treated with RAR. (D) Bar graph of SOD and GSH changes. (E) ROS generation in chondrocytes treated with various RAR concentrations was measured using the ROS probe DCFH-DA and quantified using a flow cytometer. Control vs IL-1β ##P < 0.01, ###P < 0.001; IL-1β vs RAR *P <0.05, ** P <0.01, *** P<0.001.
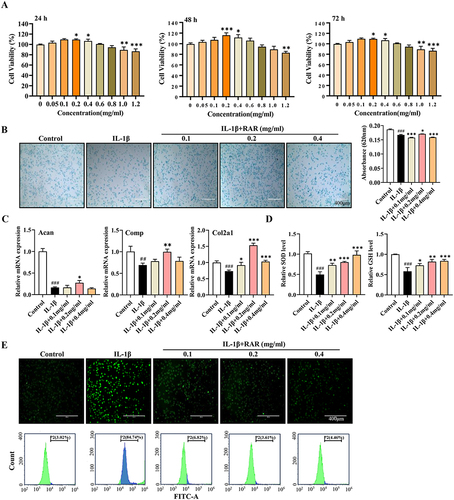
Table 2 Active Compounds Contained in RAR
Figure 5 Target selection and network construction. (A) The “drug-compound-target” network of RAR. Green represents compound targets, light blue represents compounds in RAR, and purple represents drugs. (B) Common targets between RAR and KOA.
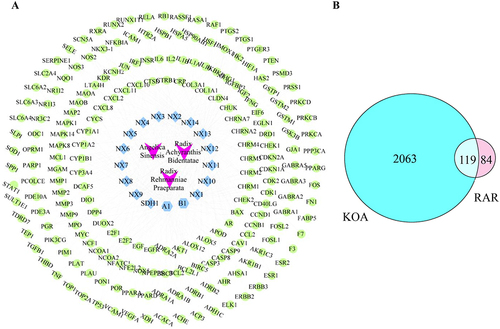
Figure 6 Construction of “drug-active component-target-disease” and PPI networks. (A) The “drug-active component-target-disease network”. The red octagon represents disease, the blue quadrangle represents active compounds, the purple quadrangle represents common components, the yellow diamonds represent drugs, and the green circle represents compound targets. (B) PPI network of RAR-targeted common proteins for KOA therapy. The target proteins are shown as diamonds, with darker hues suggesting greater relevance. (C) The nine key RAR target genes for KOA. The size and color of the circle in the figure represent the degree value, and the thickness of the links between genes represents the combined score value.
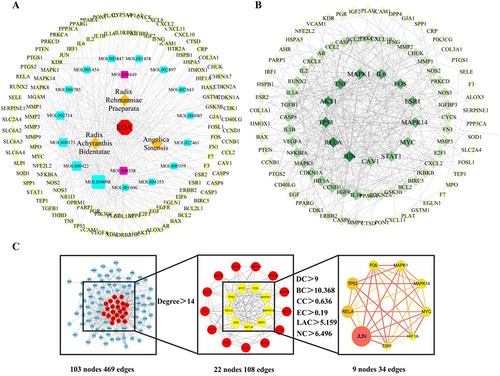
Figure 7 GO and KEGG analyses. (A) GO enrichment analysis. (B) KEGG pathway enrichment analysis.
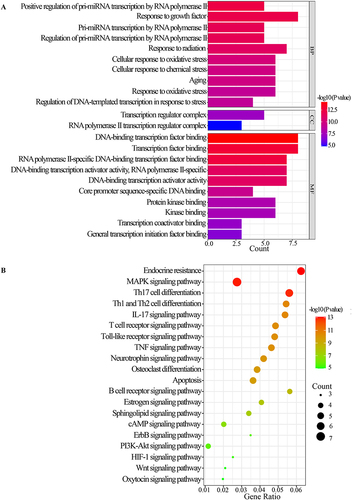
Figure 8 Molecular docking analysis. Molecular docking showed that stigmasterol and beta-sitosterol bind to Mapk1, Jun, and Rela.
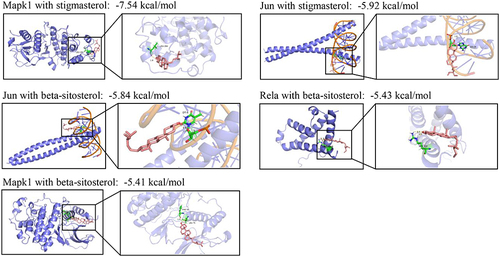
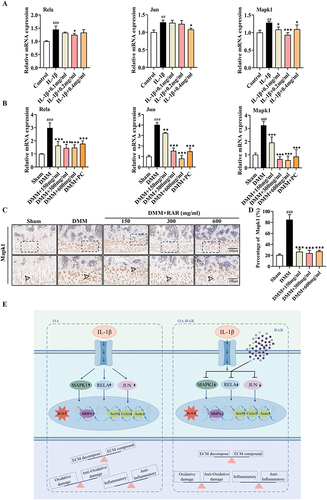
Figure 9 Verification of the mechanism by which RAR exerts its anti-KOA effects. (A) Rela, Jun, and Mapk1 mRNA expression in IL-1β-induced primary chondrocytes treated with RAR. (B) Rela, Jun, and Mapk1 mRNA expression in DMM rats treated with RAR and PC. (C) Cartilage-based Mapk1 IHC staining. Scale bar=200 μm. (D) Quantification of the percentage of positive expression of Mapk1 (%). (E) Schematic overview of mechanism was created by Figdraw. Control/Sham vs IL-1β/DMM ## P < 0.01, ###P< 0.001; IL-1β/DMM vs RAR *P <0.05, **P <0.01, ***P <0.001.