
Figures & data
Table 1 Patient Characteristics of the 34 ESCC Patients
Figure 1 Flow chart of patient’s selection.
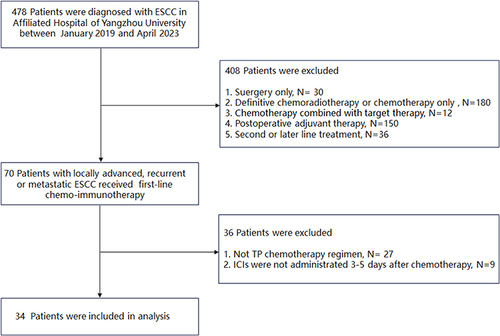
Figure 2 Percentage change of tumor size after the treatment. Each bar represents one patient with the best response in the dimension of target lesions.
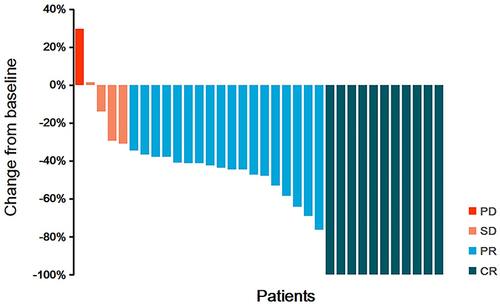
Figure 3 Kaplan–Meier curves of PFS and OS. PFS (A) and OS (B) for all patients (n=34). PFS (C) and OS (D) for patients who did not receive radical surgery treatment (n=27). PFS, progression-free survival; OS, overall survival.
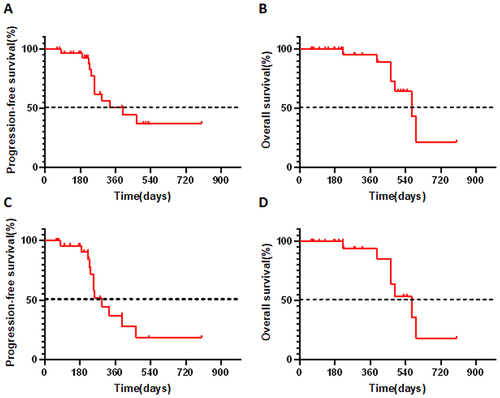
Figure 4 Kaplan–Meier curves of PFS and OS between different groups of NLR at different cycle of treatment. Kaplan–Meier curves of PFS at baseline (A), at second (B), third (C) and fourth (D) cycle of treatment. Kaplan–Meier curves of OS at baseline (E), at second (F), third (G) and fourth (H) cycle of treatment. PFS, progression-free survival; OS, overall survival; NLR, neutrophil-to-lymphocyte ratio.
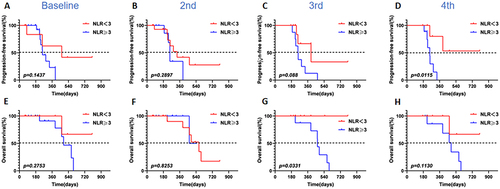
Figure 5 Kaplan–Meier curves of PFS and OS between different groups of PLR at different cycle of treatment. Kaplan–Meier curves of PFS at baseline (A), at second (B), third (C) and fourth (D) cycle of treatment. Kaplan–Meier curves of OS at baseline (E), at second (F), third (G) and fourth (H) cycle of treatment. PFS, progression-free survival; OS, overall survival; PLR, platelet-to-lymphocyte ratio.
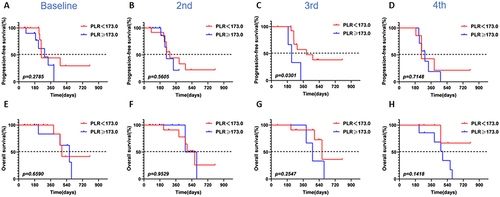
Figure 6 Kaplan–Meier curves of PFS and OS between different groups of MLR at different cycle of treatment. Kaplan–Meier curves of PFS at baseline (A), at second (B), third (C) and fourth (D) cycle of treatment. Kaplan–Meier curves of OS at baseline (E), at second (F), third (G) and fourth (H) cycle of treatment. PFS, progression-free survival; OS, overall survival; MLR, monocyte-to-lymphocyte ratio.
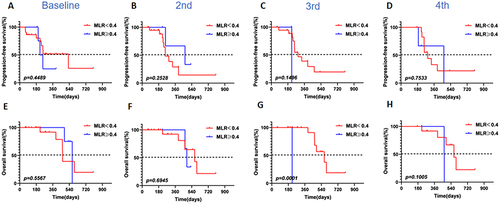
Figure 7 Kaplan–Meier curves of PFS and OS between different groups of PIV at different cycle of treatment. Kaplan–Meier curves of PFS at baseline (A), at second (B), third (C) and fourth (D) cycle of treatment. Kaplan–Meier curves of OS at baseline (E), at second (F), third (G) and fourth (H) cycle of treatment. PFS, progression-free survival; OS, overall survival; PIV, pan-immune-inflammation value.
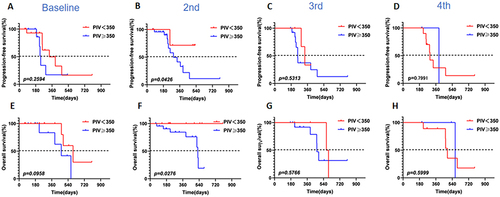
Table 2 Incidence of Adverse Events in 34 ESCC Patients Receiving Immunochemotherapy