
Figures & data
Table 1 Demographic Characteristics and Operative Data
Figure 1 Consolidated Standards of Reporting Trials (CONSORT) Diagram showing parturient recruitment and flow.
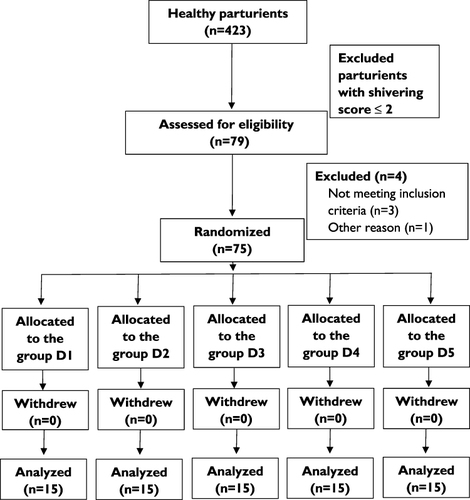
Figure 2 Dose–response curve of intravenous dexmedetomidine for treating severe shivering after caesarean delivery. The values for ED50 and ED95 calculated by probit regression model were 0.23 μg/kg (95% CI, 0.16–0.26 μg/kg), and 0.39 μg/kg (95% CI, 0.34–0.52 μg/kg) respectively.
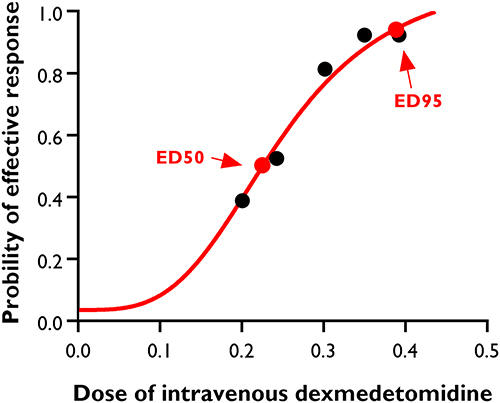
Figure 3 Changes in the heart rate and systolic blood pressure with time. Systolic blood pressure and heart rate were monitored at the following time points: before dexmedetomidine injection, 1min, 3min, 5min, 7min, 10min, 15min, 20min after dexmedetomidine injection, and at the end of surgery (T0, T1, T2, T3, T4, T5, T6, T7 and T8). The solid line showed the mean heart rate and systolic blood pressure in each group at different time points. The dotted line showed the heart rate and systolic blood pressure of each patient in each group at different time points.
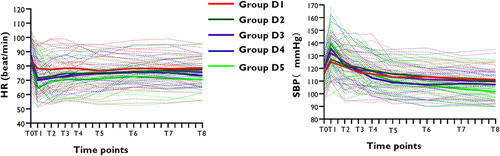
Figure 4 Changes of tympanic membrane temperature (°C). T0 = Time of arrival in operating room; T1 = the time severe shivering occurred; T2 =10 mins after dexmedetomidine injection; T3 = 20 mins after dexmedetomidine injection.
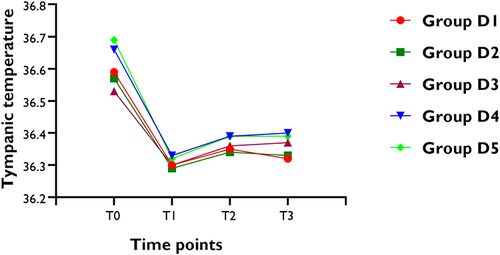
Table 2 Intra-Operative Adverse Events
Data Sharing Statement
We are committed to sharing the raw data collected during the clinical trial, including demographic information, clinical measurements, and treatment outcomes. The data can be obtained from the corresponding author ([email protected]) on reasonable request. Access to the data will be granted for research purposes only and is subject to compliance with applicable ethical guidelines and data protection regulations. Prior permission is required for any commercial use or sharing of the data. The data will be released upon publication of the manuscript and will remain accessible for a period of 2 years after publication.