Figures & data
Table 1 Primer Used for RT-qPCR
Figure 1 Effect of XFC on toe swelling and arthritis index in AA rats.
Notes: (A) Toe swelling degree of rats in each group. (B) Arthritis index of rats in each group. NC, the normal control group; MC, the model control group; XFC, the Xinfeng Capsule group; MTX, the methotrexate tablet group; XFC + EV, the Xinfeng Capsule + empty AAV group; XFC + GAS5, the Xinfeng Capsule + AAV harboring GAS5 overexpression group; XFC + NSA, the Xinfeng Capsule + NSA (a pyroptosis inhibitor) group. n=number of rats (6 rats/group).
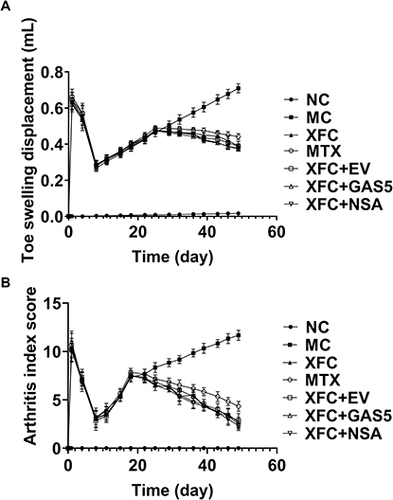
Figure 2 Effects of XFC on the histopathology of synovium and myocardium in AA rats (HE, ×200).
Notes: (A) Synovial histopathology of rats. (B) Myocardial histopathology of rats. NC, the normal control group; MC, the model control group; XFC, the Xinfeng Capsule group; MTX, the methotrexate tablet group; XFC + EV, the Xinfeng Capsule + empty AAV group; XFC + GAS5, the Xinfeng Capsule + AAV harboring GAS5 overexpression group; XFC + NSA, the Xinfeng Capsule + NSA (a pyroptosis inhibitor) group.
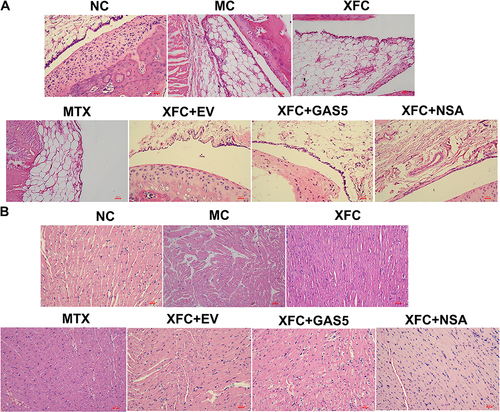
Figure 3 Effects of XFC on the ultrastructure of myocardial in AA rats (TEM, ×6000).
Notes: The ultrastructure of the myocardium in different groups of rats is shown in the figure. The red arrow refers to the pyroptotic vesicles. NC, the normal control group; MC, the model control group; XFC, the Xinfeng Capsule group; MTX, the methotrexate tablet group; XFC + EV, the Xinfeng Capsule + empty AAV group; XFC + GAS5, the Xinfeng Capsule + AAV harboring GAS5 overexpression group; XFC + NSA, the Xinfeng Capsule + NSA (a pyroptosis inhibitor) group.
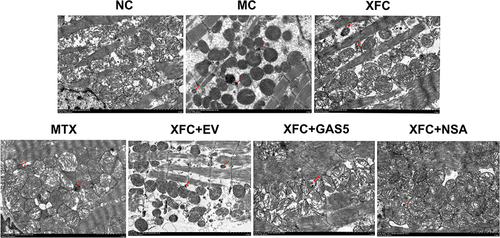
Figure 4 Effect of XFC on serum cytokines in AA rats.
Notes: (A) IL-1β levels in different groups. (B) IL-18 levels in different groups. (C) IL-6 levels in different groups. (D) TNF-α levels in different groups. NC, the normal control group; MC, the model control group; XFC, the Xinfeng Capsule group; MTX, the methotrexate tablet group; XFC + EV, the Xinfeng Capsule + empty AAV group; XFC + GAS5, the Xinfeng Capsule + AAV harboring GAS5 overexpression group; XFC + NSA, the Xinfeng Capsule + NSA (a pyroptosis inhibitor) group. Values are mean ± standard deviation, n=number of rats (6 rats/group). **P < 0.01, compared with the NC group; ##P < 0.01, #P < 0.05, compared with the MC group; ΔΔP < 0.01, ΔP < 0.05, compared with the XFC group.
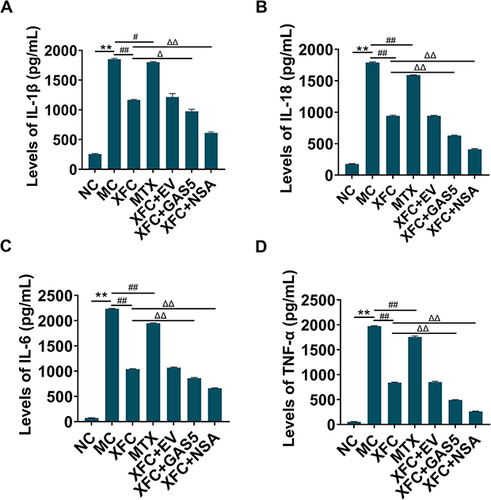
Figure 5 Effect of XFC on LDH release from myocardial tissues in AA rats.
Notes: The graph displays the statistical analysis results of LDH release from rat myocardial tissues in different groups. NC, the normal control group; MC, the model control group; XFC, the Xinfeng Capsule group; MTX, the methotrexate tablet group; XFC + EV, the Xinfeng Capsule + empty AAV group; XFC + GAS5, the Xinfeng Capsule + AAV harboring GAS5 overexpression group; XFC + NSA, the Xinfeng Capsule + NSA (a pyroptosis inhibitor) group. Values are mean ± standard deviation, n=number of rats (6 rats/group). **P < 0.01, compared with the NC group; ##P < 0.01, #P < 0.05, compared with the MC group; ΔΔP < 0.01, compared with the XFC group.
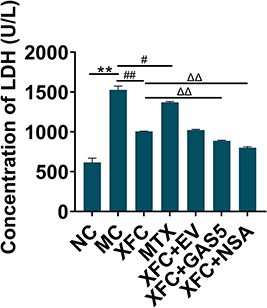
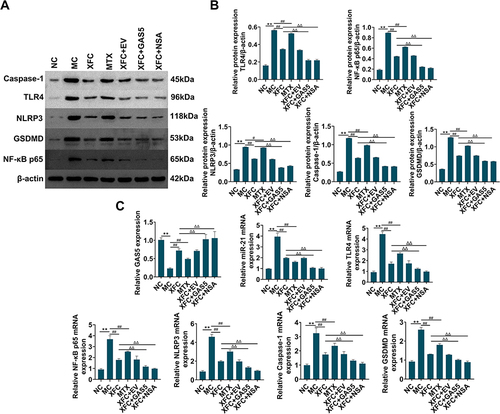
Figure 6 Effects of XFC on the expression of the GAS5/miR-21/TLR4 axis and pyroptosis-related indicators in myocardial tissues of AA rats.
Notes: (A) Protein levels of TLR4, NF-κB p65, NLRP3, Caspase-1, and GSDMD in rat myocardial tissues. (B) Semi-quantitative analysis of protein levels. (C) Expression of GAS5 and mRNA expression of miR-21, TLR4, NF-κB p65, NLRP3, Caspase-1, and GSDMD in rat myocardial tissues. NC, the normal control group; MC, the model control group; XFC, the Xinfeng Capsule group; MTX, the methotrexate tablet group; XFC + EV, the Xinfeng Capsule + empty AAV group; XFC + GAS5, the Xinfeng Capsule + AAV harboring GAS5 overexpression group; XFC + NSA, the Xinfeng Capsule + NSA (a pyroptosis inhibitor) group. Values are mean ± standard deviation, n=number of rats (6 rats/group). **P < 0.01, compared with the NC group; ##P < 0.01, #P < 0.05, compared with the MC group; ΔΔP < 0.01, compared with the XFC group.