Figures & data
Figure 1 Inflammation exacerbated the inhibition of HOK proliferation and migration with oncologic dose of ZA treatment, but did not aggravate this with the osteoporosis therapeutic dose of ZA treatment. (a) Cell viability of HOK treated with gradient concentration LPS for 48 hours. (b) Effect of the osteoporosis therapeutic dose of ZA (2.5 μM) and LPS (10 ng/mL) on HOK cell viability for 48 hours. (c) Effects of the oncologic dose of ZA (10 μM) and LPS on HOK cell viability for 48 hours. (d) Representative Western blot of PCNA. (e) Western blot analysis. (f) Western blot analysis of PCNA. (g) Quantification of Western blot results. (h) Wound healing assays in HOK cells were simulated with 2.5 μM ZA or/and 10 ng/mL LPS at 24, and 48 hours. Scale bar, 500 μm. (i) The analysis of wound healing assay. (j) Wound healing assays in HOK cells were simulated with 10 μM ZA or/and 10 ng/mL LPS at 0, 24, and 48 hours. Scale bar, 500 μm. (k) The analysis of the wound-healing assay. Data were given as the mean±SD. *P < 0.05. **P < 0.01. ***P < 0.001. ****P < 0.0001.
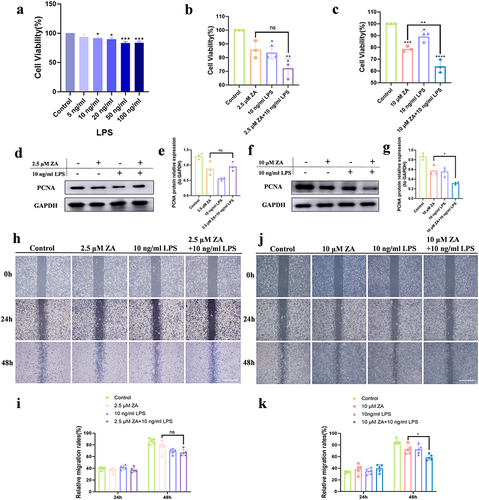
Figure 2 Inflammation exacerbated the inhibition of HOK proliferation and migration induced by the oncologic dose of ZA through up-regulation of oxidative stress. (a) Representative images of intracellular ROS fluorescence in response to 10 μM ZA or/and LPS. Scale bar, 100 μm. (b) Quantitative analysis of cellular ROS levels. (c) Representative images of intracellular ROS fluorescence in response to 5mM NAC or/and ZA+LPS. Scale bar, 100 μm. (d) Statistical analysis of intracellular ROS levels. (e) Representative images of the proliferation assay (EdU staining) of HOK cells under different treatments. Scale bar, 100 μm. (f) The bar graph showed the percentage of EdU-positive cells. (g) HOK cell wound healing experiments were simulated for 0, 24 and 48 hours according to the group. Scale bar, 500 μm. (h) The analysis of Wound-healing assay. Data were given as the mean±SD. ns: nonsense. **P < 0.01. ***P < 0.001. ****P < 0.0001.
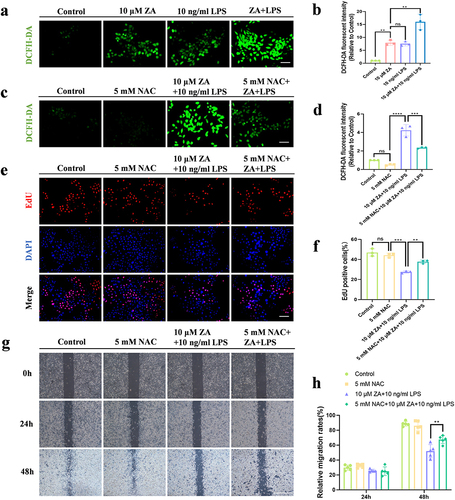
Figure 3 Inflammation exacerbated mitochondrial dysfunction caused by oncologic dose of ZA by modulating SIRT1. (a) JC-1 fluorescence staining showed MMP in the control group, the 10 μM ZA group, the 10 ng/mL LPS group, and the ZA+LPS group. Scale bar, 50 μm. (b) Statistical analysis of MMP in each group. (c) Representative images of mitochondrial distribution in each group. Scale bar, 100 μm. (d) Fluorescence intensity and statistical analysis of Mito-Tracker Green staining in each group were displayed. (e) Cellular immunofluorescence images of SIRT1. Scale bar, 100 μm. (f) Quantitative analysis of the fluorescence intensity of SIRT1. (g) Immunofluorescence staining of PGC-1α in HOK cells was observed under an inverted fluorescence microscope. Scale bar, 100 μm. (h) Quantitative analysis of PGC-1α cell immunofluorescence. (i) Western blot was used to detect SIRT1 protein levels in HOK cells after drug treatment 48 hours. (j) Quantitative analysis of SIRT1 protein bands was performed. Data were expressed as mean±SD. ns: nonsense. *P < 0.05. **P < 0.01. ***P < 0.001. ****P < 0.0001.
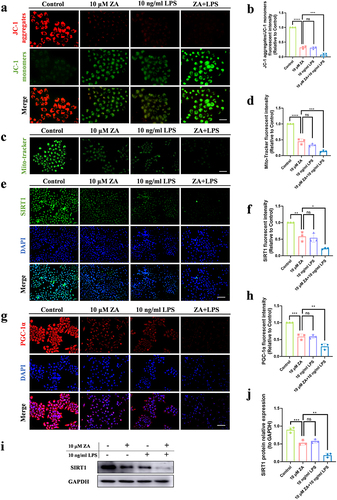
Figure 4 Res alleviated mitochondrial dysfunction and oxidative stress caused by inflammation and the oncologic dose of ZA by regulating SIRT1. (a) The expression of SIRT1 in HOK cells after drug treatment was detected by immunofluorescence assay. Scale bar, 100 μm. (b) Fluorescence quantitative analysis of SIRT1. (c) HOK cell PGC-1α expression was detected by immunofluorescence after drug treatment. Scale bar, 100 μm. (d) Fluorescence quantitative analysis of PGC-1α. (e) Fluorescence staining of JC-1 showed the MMP of each group. Scale bar, 50μm. (f) Statistical fluorescence analysis of MMP. (g) Representative images of mitochondrial distribution in each group. Scale bar, 100 μm. (h) The fluorescence intensity of Mito-Tracker Green staining was shown. (i) The oxidative stress levels in HOK cells were detected by DCFH-DA staining. Scale bar, 100 μm. (j) Statistical analysis of intracellular ROS levels. Data were expressed as mean±SD. ns: nonsense. *P < 0.05. **P < 0.01. ***P < 0.001. ****P < 0.0001.
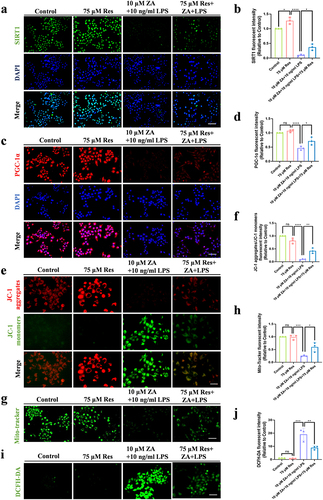
Figure 5 Inflammation aggravated the inhibitory effect of the oncologic dose of ZA on the proliferation and migration of HOK by regulating SIRT1 signaling. (a) Representative images of the proliferation assay (EdU staining) of HOK cells under different treatments. Scale bar, 100 μm. (b) The bar chart showed the percentage of EdU-positive cells. (c) The HOK cell scratch experiment was simulated for 0, 24, and 48 hours in each groups, respectively. Scale bar, 500 μm. (d) Statistical analysis of scratch experiments. (e) Western blot detection of SIRT1 protein levels in HOK cells after drug treatment. (f) Quantitative analysis of the SIRT1 protein. The data were given as the mean±SD. ns: nonsense. *P < 0.05. **P < 0.01. ***P < 0.001. ****P < 0.0001.
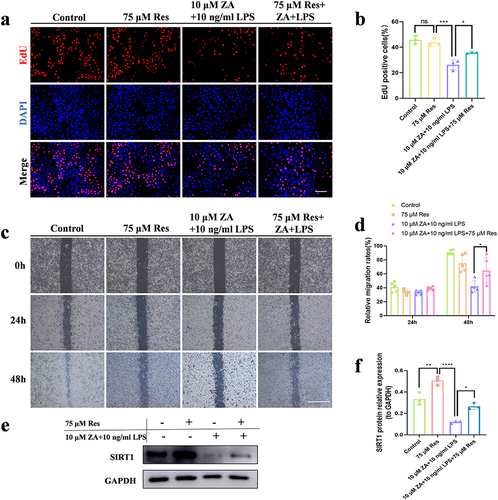
Figure 6 Inflammation as a risk factor aggravated MRONJ mucosal non-healing induced by the oncologic dose of ZA through mediating mitochondrial dysfunction and oxidative stress in a SIRT1-dependent manner. (a) Schematic drawing of the procedures conducted in this study. By Figdraw. (b) HE staining at the teeth-extracted sites in MRONJ mice models. Empty bone lacunas with no osteocytes were pointed by yellow arrows. Normal osteocytes in bone lacunas were indicated by red arrows. Scale bars, 200 μm, 100 μm, 50 μm or 20 μm. (c) The representative immunofluorescence staining images of COL1 in teeth-extracted sites. Scale bar, 50 μm. (d) Representative images of SIRT1 immunofluorescence staining in teeth-extracted sites. Scale bar, 50 μm. (e) Tissue immunofluorescence image of PGC-1α detected at teeth extraction wound site. Scale bar, 50 μm. (f) Representative images of MnSOD immunofluorescence staining in teeth-extracted sites. Scale bar, 50 μm. (g–j) Statistical analysis of immunofluorescence in tissue sections. Data were presented as mean±SD. *P < 0.05. **P < 0.01. ***P < 0.001.
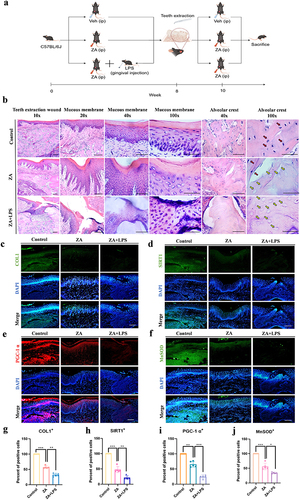
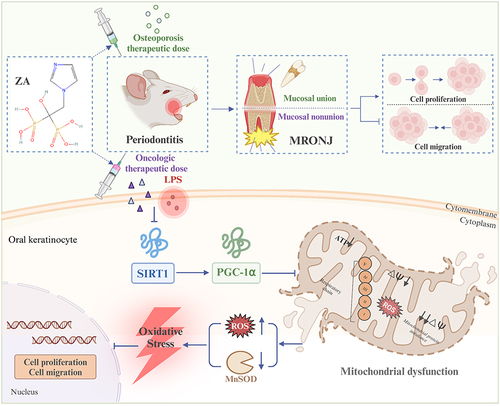
Figure 7 Inflammation exacerbated the inhibition of HOK proliferation and migration promoted by the oncologic dose of ZA treatment, but not aggravated this with the osteoporosis therapeutic dose of ZA treatment. Inflammation exacerbated the impaired mucosal healing of MRONJ extraction wounds induced by the oncologic dose of ZA. One possible mechanism may be that inflammation, as a high-risk factor, exacerbates the inhibition of HOK proliferation and migration induced by the oncologic dose of ZA by modulating mitochondrial dysfunction and the resulting oxidative stress in a SIRT1-dependent manner. There are five proteins in the inner mitochondrial membrane: complex I (NADH dehydrogenase), complex II (succinate dehydrogenase), complex III (cytochrome c reductase), complex IV (cytochrome c oxidase), and complex V (ATP synthase). Created with BioRender.com.