
Figures & data
Table 1 Quantitative Polymerase Chain Reaction Primer Sequences
Figure 1 Nepetoidin B alleviates I/R-induced liver injury and cell damage in vivo and in vitro. (A) Serum ALT and (B) AST levels in each group (n = 6/group); (C) CCK8 assay was used to detect the effect of NB on the activity of AML12 cells under normal oxygen conditions (n = 6/group); (D) CCK8 assay was used to detect the effect of NB on the activity of AML12 cells after H/R injury (n = 6/group); (E) H&E staining (the area indicated by the black arrow indicates the necrotic area) and (F) necrotic area statistics of liver tissue in mice (n = 6/group). **P < 0.01 vs sham or control group; #P < 0.05 and ##P < 0.01 vs I/R or H/R group.
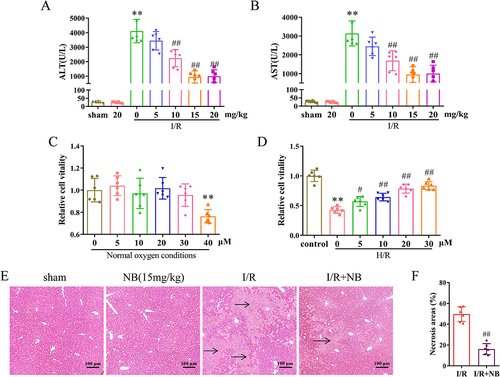
Figure 2 Nepetoidin B alleviates I/R-induced oxidation in vivo and in vitro. (A) MDA levels in liver tissue (n = 6/group). (B) SOD activity in liver tissue (n = 6/group). (C) GSH activity in liver tissue (n = 6/group). (D) DHE staining (red fluorescence indicates positive DHE staining) and (E) fluorescence intensity analysis of the liver tissue (n = 6/group). (F) DHE staining (red fluorescence indicates positive DHE staining) and (G) fluorescence intensity analysis of the AML12 cells (n = 6/group). **P < 0.01 vs sham or control group; ##P < 0.01 vs I/R or H/R group.
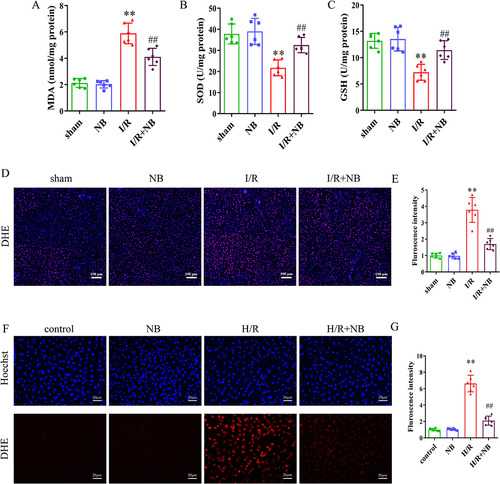
Figure 3 Nepetoidin B alleviates I/R-induced apoptosis in vivo and in vitro. (A) TUNEL staining (green fluorescence indicates TUNEL positives cells) and (B) statistical analysis of the mouse liver tissue (n = 6/group). (C and D) Apoptosis was determined using flow cytometry (n = 6/group). (E) Detection of apoptotic proteins and (F–H) statistical analysis of the mouse liver tissue (n = 6/group). (I) Detection of apoptotic proteins and (J–L) statistical analysis of the AML12 cells (n = 6/group). **P < 0.01 vs sham or control group; ##P < 0.01 vs I/R or H/R group.
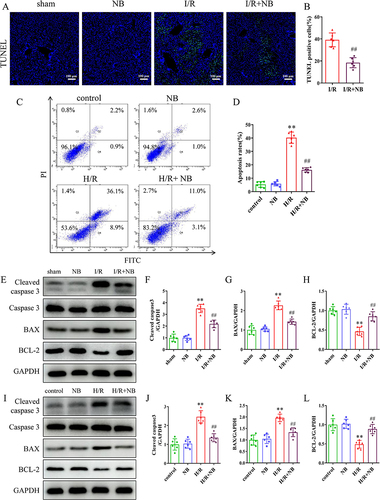
Figure 4 Nepetoidin B alleviates I/R-induced inflammation in vivo and in vitro. (A–C) Serum contents of IL-1β, IL-6, and TNF-α were detected by ELISA (n = 6/group). (D) Ly6g immunofluorescence staining (red fluorescence indicates Ly6g positive cells) and (E) statistical analysis of mouse liver tissue (n = 6/group). (F) CD11b immunofluorescence staining (red fluorescence indicates CD11b positive cells) and (G) statistical analysis of the mouse liver tissue (n = 6/group). (H–J) mRNA expression of Il-1β, Il-6 and Tnf-α in AML12 cells (n = 6/group). **P < 0.01 vs sham or control group; ##P < 0.01 vs I/R or H/R group.
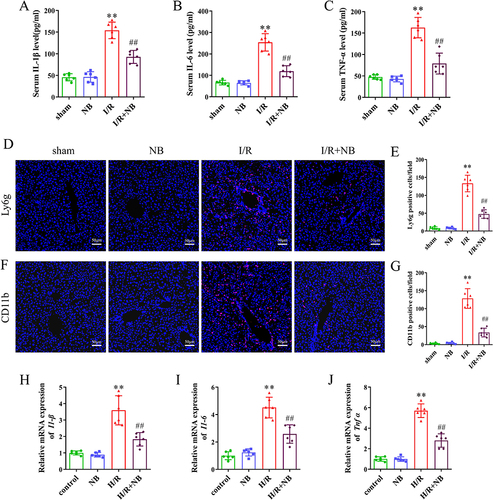
Figure 5 Nepetoidin B inhibits P38/JNK signaling in vivo and in vitro. (A) Detection of total and phosphorylated JNK and P38 proteins and (B and C) statistical analysis of mouse liver tissue (n = 6/group). (D) Detection of total and phosphorylated JNK and P38 proteins and (E and F) statistical analysis of AML12 cells (n = 6/group). **P < 0.01 vs sham or control group; ##P < 0.01 vs I/R or H/R group.
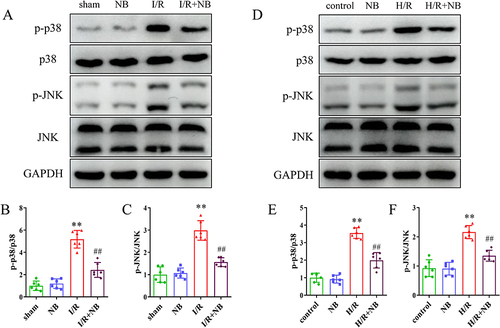
Figure 6 Nepetoidin B promoted the expression of MKP5 in vivo and in vitro. (A) Molecular docking of nepetoidin B and MKP5, (B) protein detection and (C) statistical analysis of MKP5 in mouse liver tissue (n = 6/group). (D) Protein detection and (E) statistical analysis of MKP5 expression in AML12 cells (n = 6/group). **P < 0.01 vs sham or control group; ##P < 0.01 vs I/R or H/R group.
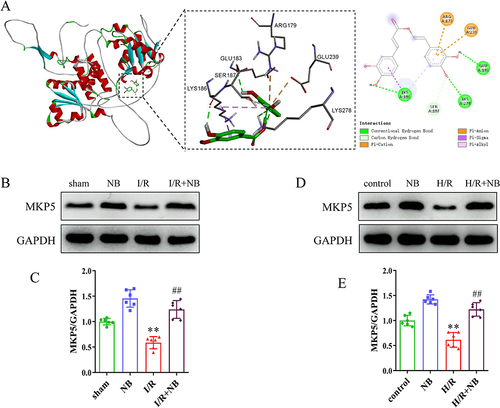
Figure 7 Knockout of MKP5 attenuated the hepatoprotective effect of nepetoidin B. (A and B) Serum ALT and AST levels (n = 6/group), (C) HE staining (the area indicated by the black arrow indicates the necrotic area) and (D) necrotic area statistics (n = 6/group), (E) DHE staining (red fluorescence indicates positive DHE staining) and (F) fluorescence intensity analysis of liver tissue (n = 6/group), (G) TUNEL staining (green fluorescence indicates TUNEL-positive cells) and (H) statistical analysis (n = 6/group), (I–K) serum levels of Il-1β, Il-6, and TNF-α (n = 6/group), (L and M) protein expression of MKP5, the JNK/P38 pathway, and statistical analysis of liver tissues (n = 6/group). **P < 0.01 vs sham group; ##P < 0.01 vs I/R group; $$P < 0.01 vs I/R group; &&P < 0.01 vs I/R+NB group.
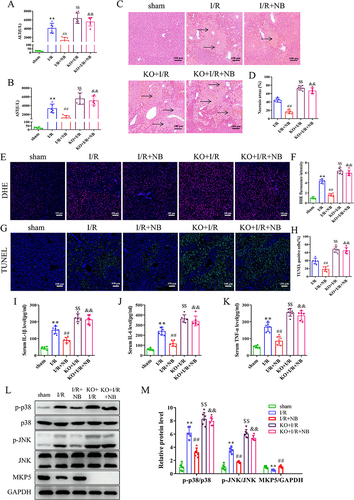
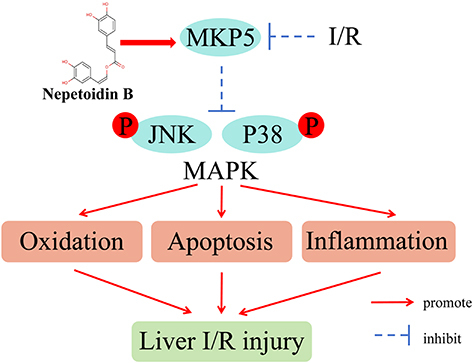
Figure 8 The schematic representation of the mechanism by which nepetoidin B alleviates liver ischemia/reperfusion injury.
Data Sharing Statement
The data underlying this article will be shared upon reasonable request by the corresponding author.