Figures & data
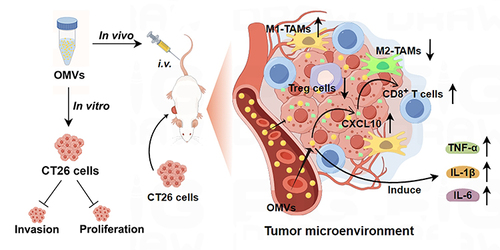
Figure 1 Identification and characterization of Pd-OMVs. (A) Isolation and purification procedures of Pd-OMVs. (B) TEM images of Pd-OMVs. (C) Size distribution of Pd-OMVs. (D) Zeta potential of Pd-OMVs (n = 6). (E) Protein profiles of Pd and Pd-OMVs (n = 3). (F) Summary of protein identification results for Pd-OMVs. (G) KEGG and (H) GO enrichment analysis items. The red boxes show the key items related to the proteins of Pd-OMVs.
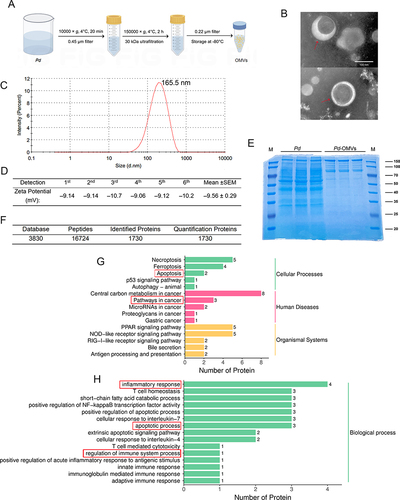
Figure 2 In vitro antitumor activity of Pd-OMVs. (A) Uptake profiles of Pd-OMVs by CT26 cells. Viabilities of CT26 cells after co-incubated with Pd-OMVs for (B) 24 and (C) 48 h. (D) Invasion of CT26 cells after co-incubation with Pd-OMVs for 24 h. Data are presented as the mean ± SEM (n = 3). **p < 0.01, ***p < 0.001.
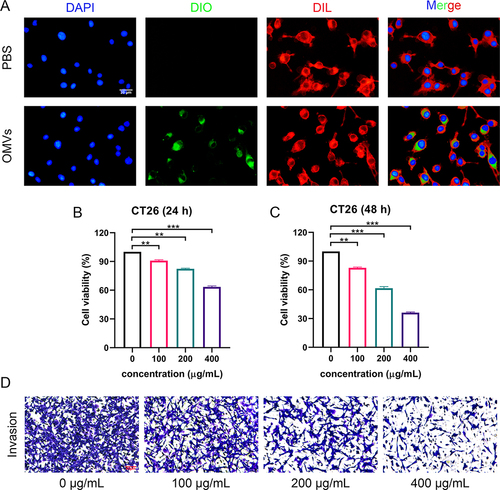
Figure 3 Pd-OMVs inhibited colon tumor growth. (A) Experimental design for evaluating the anti-colon tumor effects of Pd-OMVs given intratumorally. (B) Variation of tumor volume within 8 days after intratumoral injection of Pd-OMVs. (C) Comparison of tumor morphologic features. (D) Tumor volume and (E) weight on day 8. (F) TGI in each treatment group. Data are presented as the mean ± SEM (n = 6). **p < 0.01, ***p < 0.001.
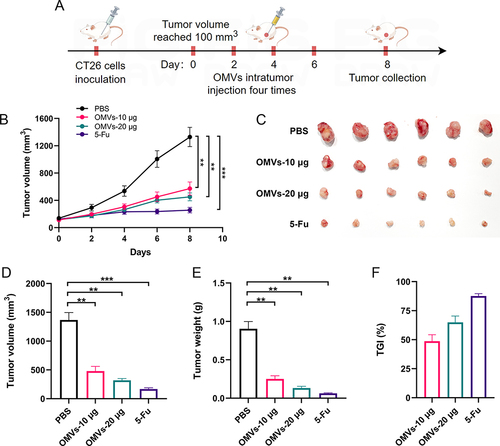
Figure 4 Transcriptome characteristics of tumor tissues treated by Pd-OMVs. (A) Scores OPLS-DA plot. (B) Volcano plot. (C) KEGG and (D) GO enrichment analysis items. GSEA enrichment plots of (E) TNF signaling pathway and (F) immune response.
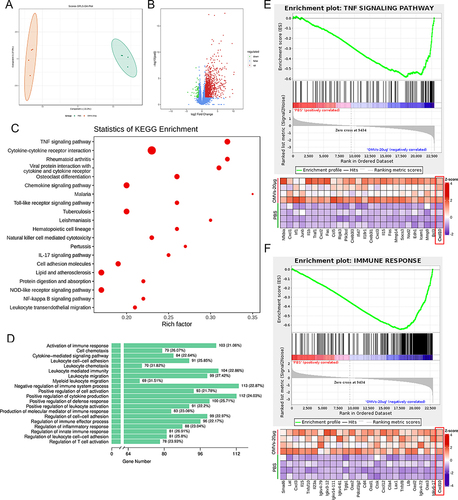
Figure 5 Pd-OMVs promoted the expression of CXCL10 subsequently recruiting CD8+ T cells to enhance the antitumor immune response. (A) The mRNA expression of CXCL10. (B) The protein expression of CXCL10. (C) CD8+ T cells in tumor tissues. (D) GrB+CD8+ T cells in tumor tissues. (E) IHC images of CXCL10 and CD8. (F) The mRNA expressions of TNF-α, IL-1β and IL-6. (G) The protein expressions of TNF-α, IL-1β and IL-6. Data are presented as the mean ± SEM (n = 6). *p < 0.05, **p < 0.01, ***p < 0.001.
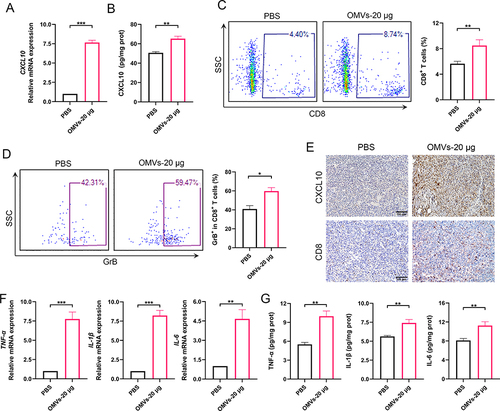
Figure 6 CXCL10 mediated the infiltration of CD8+ T cells and the antitumor effects of Pd-OMVs. (A) Experimental design for assessing the anti-colon tumor effects of Pd-OMVs. Anti-CXCL10 antibody was used to block CXCL10 expression in tumor tissues. (B) Comparison of tumor morphologic features. (C) Tumor volume and (D) weight on day 8 after Pd-OMVs administration. (E) Variation of tumor volume within 8 days. (F) The protein expression of CXCL10 in tumor tissues. (G) H&E and IHC images of CXCL10 and CD8. Data are presented as the mean ± SEM (n = 6). *p < 0.05, **p < 0.01.
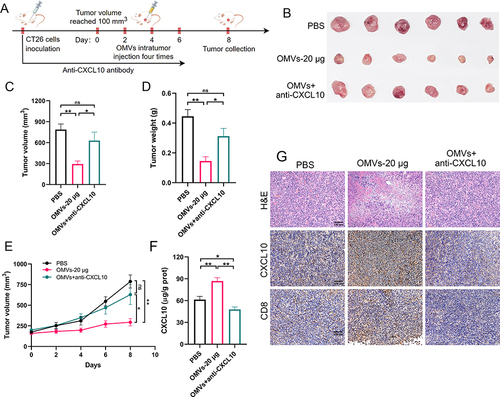
Figure 7 In vivo antitumor effects of Pd-OMVs administered intravenously. (A) In vivo biodistribution of DIR-loaded Pd-OMVs in tumor tissues (n = 3). (B) Experimental design for assessing the anti-colon tumor effects of Pd-OMVs given intravenously. (C) Comparison of tumor morphologic features. (D) Tumor volume and (E) weight after Pd-OMVs intravenous injection. (F) Variation of tumor volume within 8 days. (G) H&E and IHC images of CXCL10, CD8 and Ki67. The (H) mRNA and (I) protein expressions of CXCL10. (J) The mRNA expressions of TNF-α, IL-1β and IL-6. (K) The protein expressions of TNF-α, IL-1β and IL-6. Data are presented as the mean ± SEM (n = 6). *p < 0.05, **p < 0.01, ***p < 0.001.
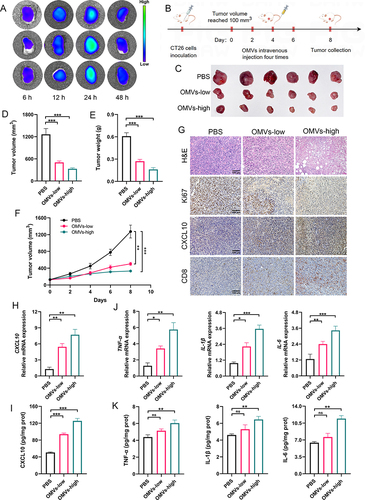
Figure 8 Biosafety evaluation of Pd-OMVs in mice. (A) Body weight variation in mice after intravenous administration of Pd-OMVs. The protein expression of (B) TNF-α, (C) IL-1β and (D) IL-6 in plasma. The levels of (E) GRE, (F) BUN, (G) ALP, (H) ALT and (I) AST. (J) H&E images of heart, liver, spleen, lung and kidney after Pd-OMVs administration. Data are presented as the mean ± SEM (n = 6). *p < 0.05.
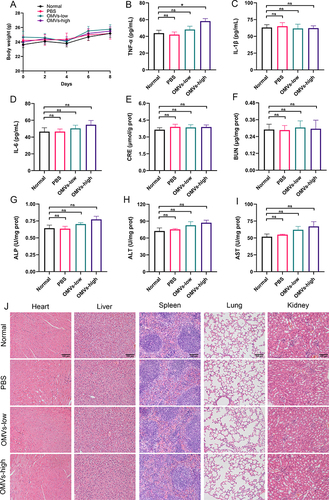
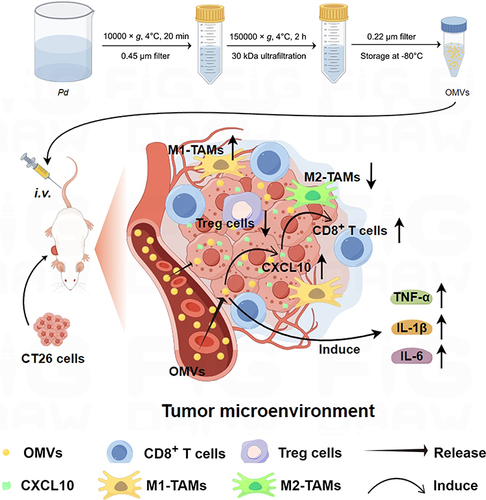
Figure 9 Scheme of the molecular mechanisms underlying Pd-OMVs against colon tumor growth (By Figdraw). The Pd-OMVs were extracted from Pd cultures via ultracentrifugation. After intravenous injection, Pd-OMVs reached the tumor site and upregulated the expression of CXCL10, which in turn promoted the migration of CD8+ T cells to tumor tissues and upregulated the expression of pro-inflammatory cytokines. Ultimately, the anti-colon cancer effects of Pd-OMVs were achieved by enhancing antitumor immunity.