Figures & data
Figure 1 Representative gas chromatography–mass spectrometry (GC–MS) total ion chromatograms (TICs) from quality control (QC) samples. (A) the hippopotamus and (B) the the cerebral cortex.
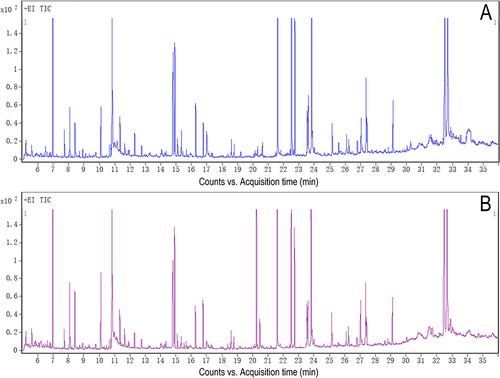
Table 1 The Scores of the Model Parameters
Figure 2 OPLS-DA score plots and permutation tests. (A)Hippocampus (B) Cerebral cortex.
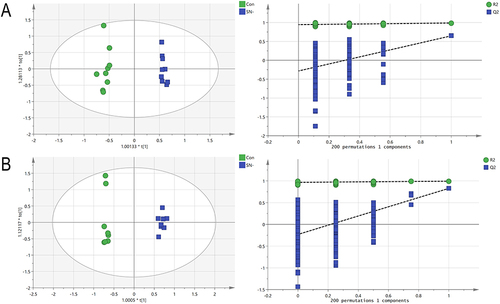
Table 2 Differential Metabolites in Different Tissues After SN-38 Treatment
Figure 3 Heatmap of differential metabolites in the SN-38 group compared with controls, featuring: (A) Hippocampus and (B) Cerebral Cortex.Each color in the heatmap represents metabolite changes: blue for down-regulation, and red for up-regulation.In the heatmap, rows represent samples and columns represent metabolites.
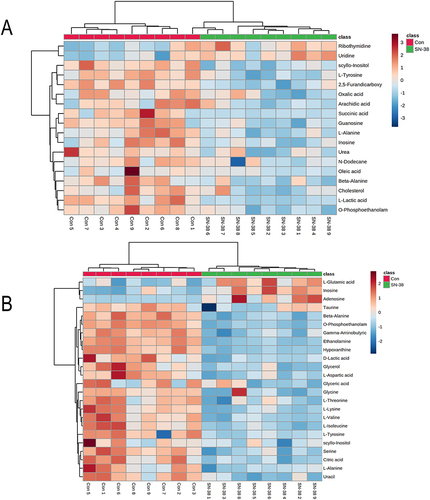
Table 3 Pathway Analysis Performed Using MetaboAnalyst 6.0 Software
Figure 4 Summary of the pathway analysis conducted with MetaboAnalyst 6.0. The metabolome view shows all matched pathways according to the p values from the pathway enrichment analysis and pathway impact values from the pathway topology analysis. (A)Hippocampus: a Propanoate metabolism; b Purine metabolism; c Alanine, aspartate and glutamate metabolism; d Phenylalanine, tyrosine and tryptophan biosynthesis; e Biosynthesis of unsaturated fatty acids; f Pyrimidine metabolism; (B) Cerebral cortex: c Alanine, aspartate and glutamate metabolism; g Glyoxylate and dicarboxylate metabolism; h Valine, leucine and isoleucine biosynthesis; i Pantothenate and CoA biosynthesis; j Glycine, serine and threonine metabolism; k beta-Alanine metabolism; l Arginine biosynthesis; m Butanoate metabolism; n Histidine metabolism; o Glycerolipid metabolism.
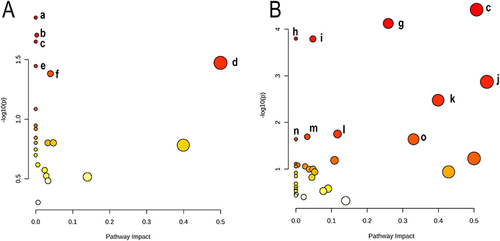
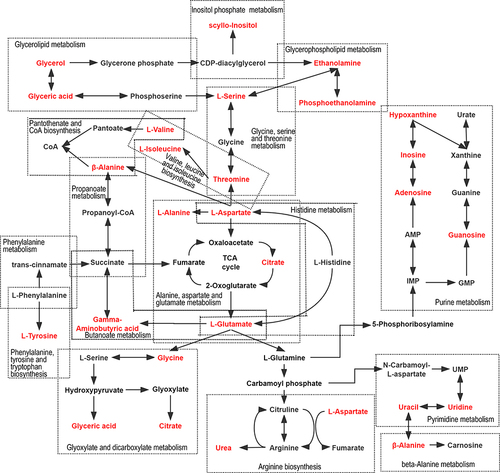
Figure 5 Schematic diagram showing metabolic pathways in tissues affected by SN-38 processing.Metabolites marked in red indicate potential biomarkers identified in this study.