
Figures & data
Figure 1 BDD improves anxiety behaviors. (A) Anxiety-like behaviors induced by CRS. (B and C) The movement trails of the rats in each group assessed using a video tracking software in the open field test (B) and elevated cross maze test (C). (D and E) Results of open field test were the center distance (D) and central enter times (E). (F and G) Results of elevated plus maze test were the proportion of time keeping the open arm (OT%) (F) and the proportion of entering the open arm (OE%) (G). The immobile times in the forced swimming test (H). Values are expressed as means ± SD. n=6 rats per group. **P<0.01, significant differences compared with the CON group; #P<0.05, ##P<0.01, significant differences compared with the CRS group.
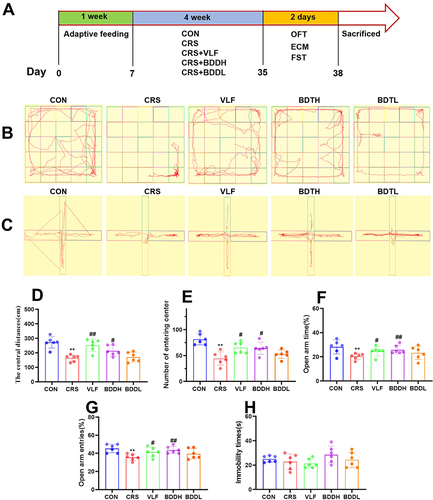
Table 1 Characterization of the Main Metabolites in BDD by UPLC-Q-TOF/MS
Figure 2 Representative total ion current profiles of BDD in positive (A) and negative (B) ion modes.
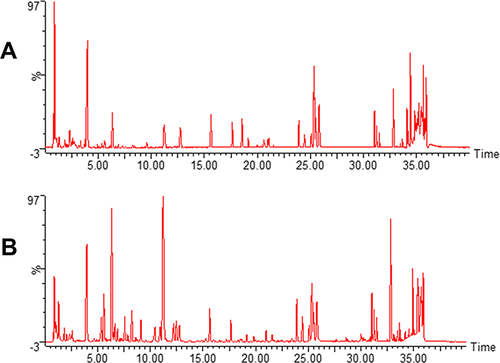
Figure 3 BDD reduces inflammatory factors, hippocampal damage, and microglia activation. (A–D) Levels of inflammatory factors in the hippocampus (n=6). (E) Representative HE staining of hippocampal tissue (200×). (F) Representative immunofluorescence staining of IBA1 (red) in the hippocampal tissue (100×). Values are expressed as means ± SD. (n=6). *P<0.05, **P<0.01, significant differences compared with the CON group; #P<0.05, ##P<0.01, significant differences compared with the CRS group.
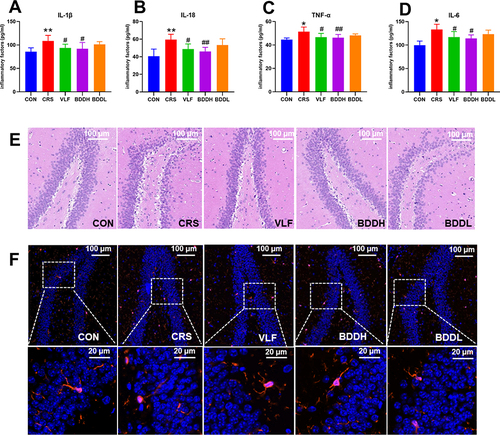
Figure 4 BDD reverses abnormal diversity of gut microbiota. (A) Alpha diversity analysis of the CON, the CRS, and BDDH groups. (B) Principal coordinate analysis. (C) Non-metric multidimensional scaling analysis of the CON, CRS, and BDDH groups based on the weighted UniFrac distance algorithm. (D) Samples distances heat map on OTU level. n=6 rats per group. **P<0.01, significant differences compared with the CON group; ##P<0.01, significant differences compared with the CRS group; ns, no significant difference between two groups.
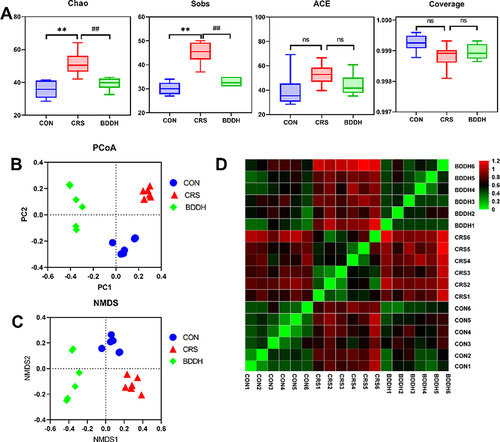
Figure 5 BDD ameliorates the abnormal abundance of potential microbial biomarkers at the phylum level. (A) Average relative abundances at the phylum level in the CON, the CRS, and BDD groups. (B–F) Comparison of relative abundances of potential microbial biomarkers at the phylum level in the CON, CRS, and BDD groups. n=6 rats per group. *P<0.05, **P<0.01, significant differences compared with the CON group; ##P<0.01, significant differences compared with the CRS group; ns, no significant difference between two groups.
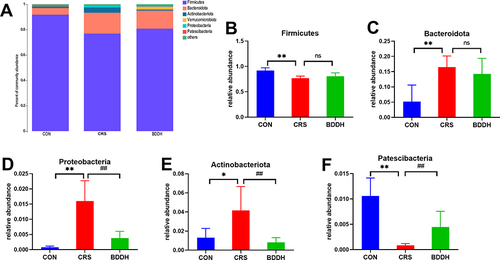
Figure 6 BDD ameliorates the abnormal abundance of potential microbial biomarkers at the genus level. (A) Average relative abundances at the genus level in the CON, the CRS, and BDDH groups. (B–K) Comparison of relative abundances of potential microbial biomarkers at the genus level in the CON, CRS, and BDDH groups. n=6 rats per group. **P<0.01, significant differences compared with the CON group. ##P<0.01, significant differences compared with the CRS group.
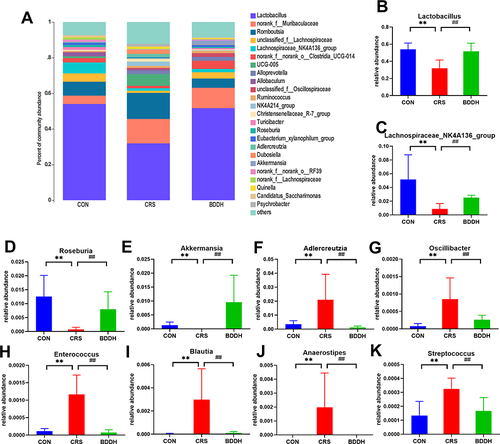
Figure 7 BDD normalizes the disturbed metabolic profiles. (A and B) PCA score plots of fecal samples of rats in different groups in positive (A) mode and negative mode (B). (C and D) OPLS DA score plots fecal samples of rats in different groups in positive mode (C) and negative mode (D). (E and F) OPLS DA model validation plot of fecal samples of rats in different groups in positive mode (E) and negative mode (F). (G and H) The heat map of different metabolites both in positive (G) and in negative ion modes (H). R2 and Q2 represent the interpretation rate of the model to the matrix and the prediction ability of the model, respectively.
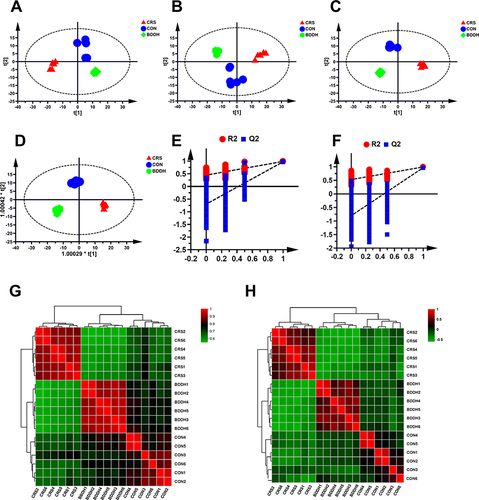
Table 2 Potential Biomarkers Associated with CRS and Their Variation Tendency After BDD Treatment Based on UPLC-Q-TOF/MS
Figure 8 BDD significantly recovers neurotransmitter dysfunction. (A) PCA score plots of neurotransmitters. (B) OPLS DA score plots of neurotransmitters. (C) Heat map of neurotransmitters. (D) Levels of neurotransmitters in the hippocampus. n= 6 rats per group. *P<0.05, **P<0.01, significant differences compared with the CON group; #P<0.05, ##P<0.01, significant differences compared with the CRS group.
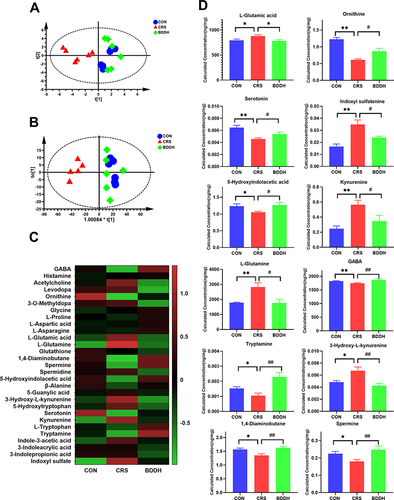
Figure 9 Metabolic pathways and network analysis. (A and B) Summary of pathway analysis in fecal (A) and hippocampus (B) samples with MetaboAnalyst. (C) Metabolic network analysis. Red up arrow or red down arrow means that the hippocampal metabolite is significantly increased or decreased compared with the CRS group; green up arrow or green down arrow means that the fecal metabolite is significantly increased or decreased compared with the CRS group.
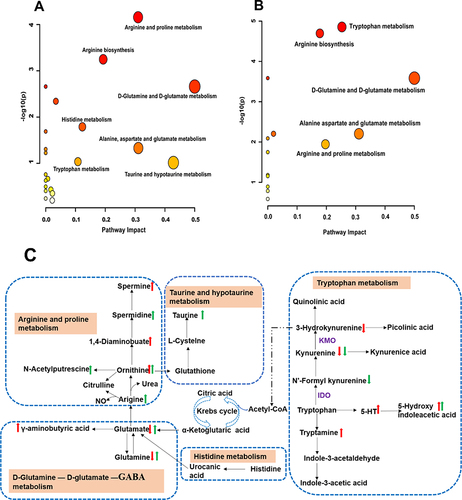
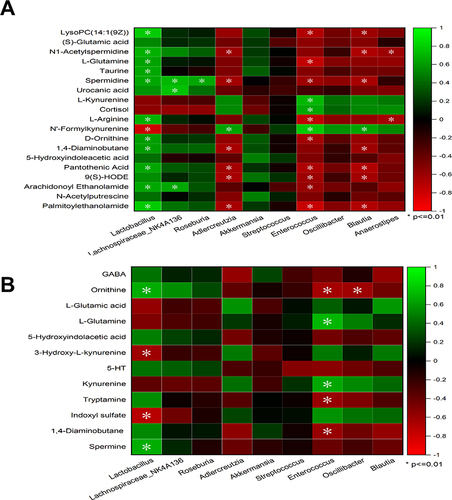
Figure 10 Correlation analysis between metabolites and microorganisms. Pearson correlation analysis among microbial biomarkers and differential metabolites in fecal samples (A). Pearson correlation analysis among microbial biomarkers and neurotransmitters in the hippocampus (B). The color key represents Pearson’s correlation coefficient. The green color indicates positive correlations, while the red color indicates negative correlations. n=6 rats per group, significance is indicated as *P<0.01.
Data Sharing Statement
Raw sequencing data can be identified in the NCBI Sequence Read Archive (accession number PRJNA1047763). The datasets during the current study available from the corresponding author on reasonable request.