
Figures & data
Figure 1 PRISMA flowchart of the study.
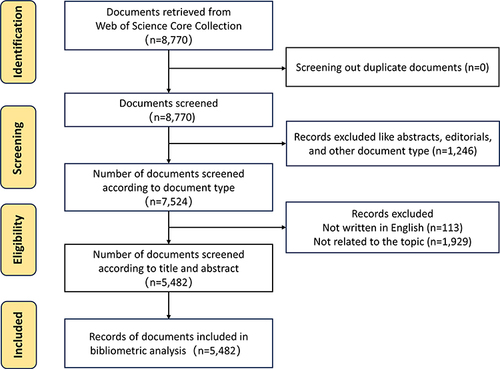
Figure 2 Bibliometric analysis of publication outputs. (A) The number of annual publications. (B) The distribution of publications by countries/regions.
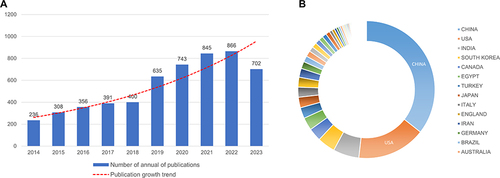
Table 1 The Top 10 Countries/Regions and Institutions Involved in Dexmedetomidine
Figure 3 Cooperation between countries/regions on dexmedetomidine. (A) The cooperation networks between different countries/regions; (B) Countries/regions cross-chord charts; (C) Geography map of countries/regions for dexmedetomidine.
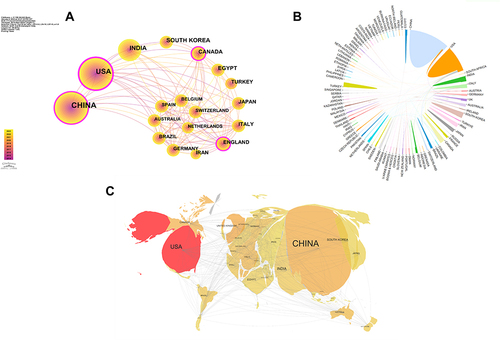
Figure 4 Cooperation between institutions on dexmedetomidine. (A) The cooperation networks between different institutions; (B) The top 10 institutions in count; (C) The top 10 institutions in centrality.
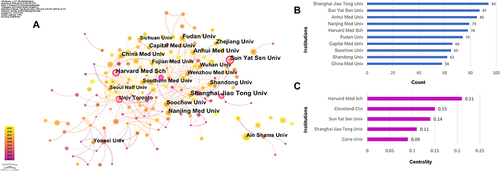
Table 2 The Top 10 Authors and Cited Authors in Dexmedetomidine
Figure 5 Authors analysis on dexmedetomidine. (A) The cooperation networks between different authors; (B) The density visualization map of authors based on VOSviewer; (C) The cooperation networks between different cited authors.
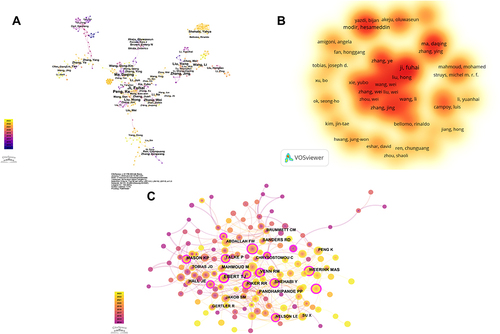
Table 3 According to Bradford’s Law, the 1,186 Journals in Dexmedetomidine were Classified into Zones 1–3
Figure 6 Journals analysis on dexmedetomidine. (A) Journals output trends within the top 5 from 2014 to 2023; (B) Core journals by Bradford’s law.
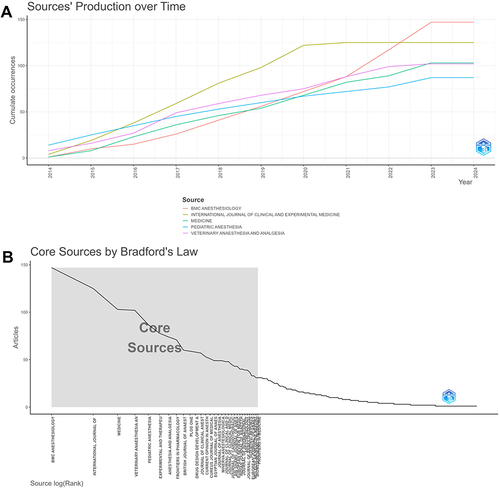
Table 4 The Top 10 Cited Journals in Dexmedetomidine
Figure 7 Cited journals analysis on dexmedetomidine. (A) The network map of cited journals; (B) The top 10 cited journals in count; (C) The top 10 cited journals in centrality; (D) The dual-map overlay of citing of citation relationship of articles, with citing journal on the left, and the cited journal on the right. The colored path represented the citation relationship.
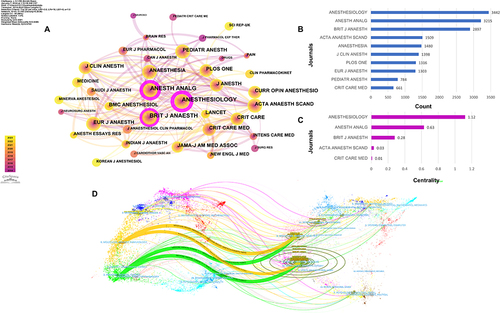
Table 5 The Top 10 Cited References in Dexmedetomidine
Figure 8 Cited references analysis on dexmedetomidine. (A) The network map of cited references; (B) The clustering of cited references; (C) The top 30 cited references with the strongest citation bursts.
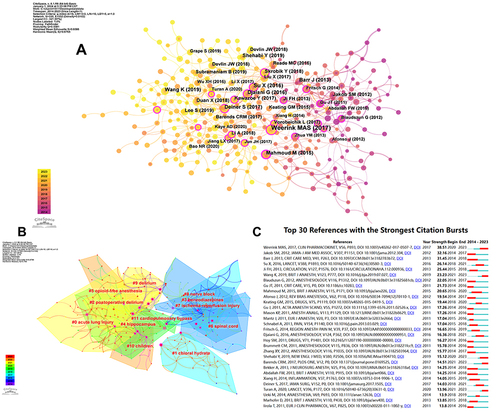
Table 6 Top 10 Productive WOS Categories in Dexmedetomidine, Ranked by the Number of Publications
Figure 9 R bibliometrics-thematic evolution tool traces the progression of research themes in the realm of dexmedetomidine, spanning from 2014 to 2023.
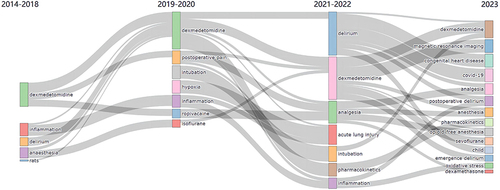
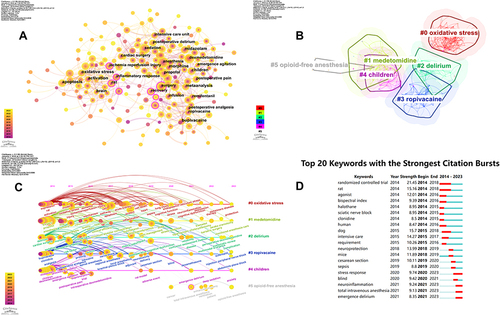
Figure 10 Keywords analysis on dexmedetomidine. (A) The network map of the co-occurrence keywords; (B) Clusters of keywords; (C) Timeline view of keywords analysis; (D) The top 20 keywords with the strongest citation bursts.
Data Sharing Statement
The datasets used or analyzed during the current study are available from the corresponding author on reasonable request.