
Figures & data
Table 1 Constituents of PSORI-CM01
Table 2 Clinical Serum Samples for miRNA Analysis
Figure 1 Activated Chemical Composition, targets of PSORI-CM01 and target of psoriasis. (A) Herb-compounds-targets network of PSORI-CM01; (B) Venn analysis of targets between targets of PSORI-CM01 compounds and target of psoriasis; (C) protein–protein interaction (PPI) network of intersection targets.
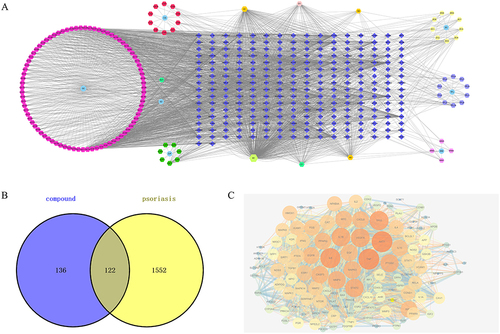
Figure 2 Go function and KEGG pathway enrichment analysis of PSORI-CM01 in the treatment of psoriasis. (A) Biological processes (BP); (B) cellular component (CC); (C) molecular function (MF); (D) KEGG pathway enrichment of the intersection targets; (E) Categorization of KEGG pathway enrichment; (F) gene-concept network analysis on KEGG enrichment; (G) enrichment map analysis on KEGG enrichment.
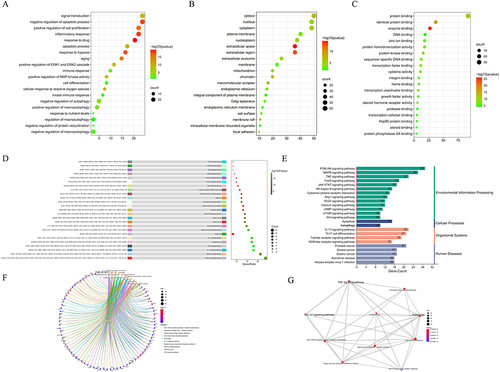
Figure 3 Molecular Docking PSORI-CM01 components docked with key targets. (A) MOL000098 docked with IL6; (B) MOL000422 docked with TP53; (C) MOL004328 docked with STAT3. (D) Key Target-miRNA Regulatory Network.
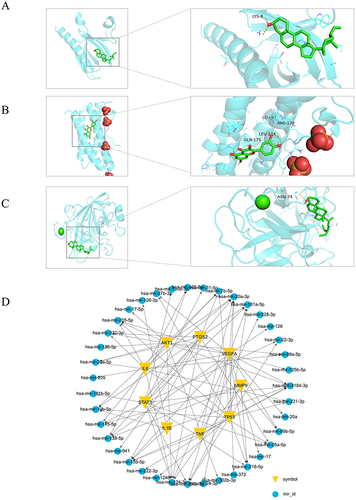
Table 3 Analysis of Differentially Expressed miRNAs Between Groups
Figure 4 Unsupervised hierarchical cluster analysis of differentially expressed miRNAs before and after PSORI-CM01 treatment. (A) Volcanic map of PSORI-CM01 group before treatment versus the control group; (B) Volcanic map of PSORI-CM01 group after treatment versus the control group; (C) Volcanic map of PSORI-CM01 group after treatment versus PSORI-CM01 group before treatment; (D) Heat map of PSORI-CM01 group before treatment versus the control group; (E) Heat map of PSORI-CM01 group after treatment versus the control group; (F) Heat map of PSORI-CM01 group after treatment versus PSORI-CM01 group before treatment.
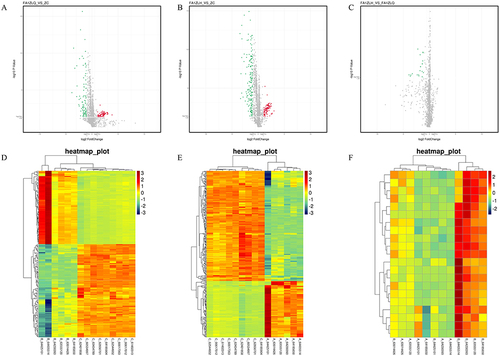
Figure 5 Pathway enrichment analysis for differentially expressed miRNAs and Verification of selected microRNAs. (A and B) Pathway enrichment analysis for differentially expressed miRNAs. (C) The miRNAs validation of miR-20a-3p, miR-3184-3p, miR-487a-3p, miR-4793-3p, miR-3653-3p, miR-5681b and miR-26a-5p by qRT-PCR. (*P < 0.05, **P < 0.01 vs PSORI-CM01 group 0-week group; #P < 0.05, ##P < 0.01 vs PSORI-CM01 group 12 weeks group).
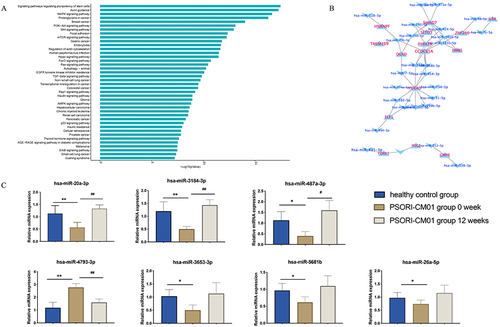
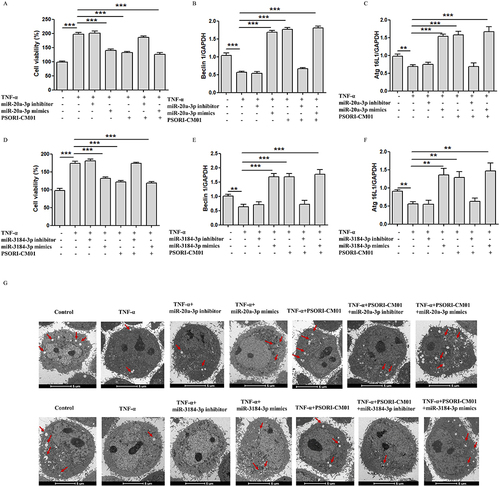
Figure 6 miR-20a-3p and miR-3184-3p induces autophagy and inhibits proliferation of TNF-ɑ induced keratinocytes. (A) Inhibitors and mimics of miR-20a-3p on HaCaT cells were detected by MTT; (B and C) Expression of Beclin1 and ATG16L1 evaluated by qRT-PCR after inhibitors and mimics of miR-20a-3p; (D) Inhibitors and mimics of miR-3184-3p on HaCaT cells were detected by MTT; (E and F) Expression of Beclin1 and ATG16L1 evaluated by qRT-PCR after inhibitors and mimics of miR-3184-3p; (G) Autophagosomes in HacaT was observed by TEM (Scale bar = 5 μm; red arrow: autophagosome); (**P < 0.01, ***P < 0.001 vs TNF-α).
Data Sharing Statement
The datasets during and/or analyzed during the current study available from the corresponding author on reasonable request.