Figures & data
Figure 1 Morin alleviates vincristine induced allodynia. (A) The experimental protocol of this study. (B and C) Changes in MWT and TWL of rats in each group. n=6 rats for each group. ***p < 0.001 compared with control group, ###p < 0.001 compared with vincristine group. Data were shown as mean ± SD.
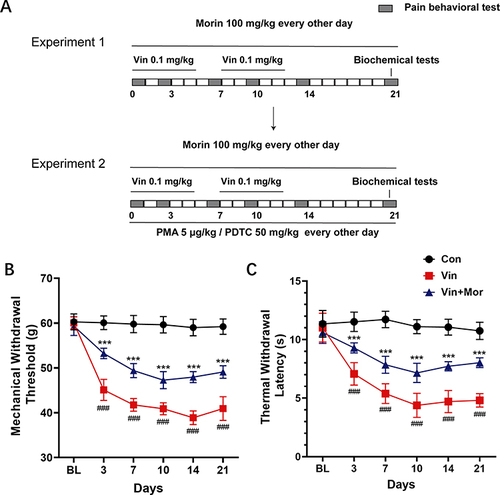
Figure 2 Morin alleviates vincristine-induced sciatic nerve injury. (A) Changes of sciatic nerve conduction velocity in each group. n=6 rats for each group. ***p < 0.001 compared with control group, ###p < 0.001 compared with vincristine group. Upper and down panels represented the action potentials recorded at the near-end and far-end of the sciatic nerve, respectively. (B) Representative images of rat sciatic nerve transmission electron microscope (yellow ↑, ○: myelin sheath, cyan ↑: Schwann cells). (C) Changes in the concentrations of pro-inflammatory factors and anti-inflammatory factors in cerebral cortex of rats in each group. n=6 rats for each group. ***p < 0.001 compared with control group, ###p < 0.001 compared with vincristine group. Data were shown as mean ± SD.
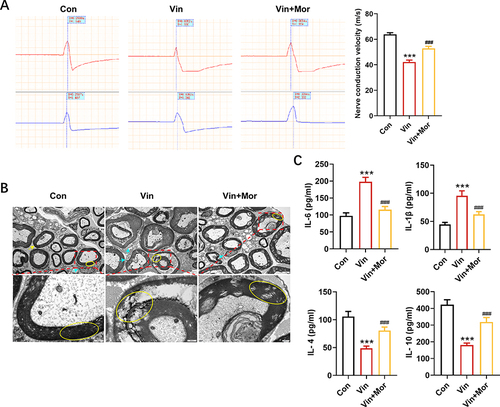
Figure 3 Morin attenuates vincristine-induced neuroinflammation by regulating M1/M2 polarization of microglia. (A, E, I) Representative images of ARG1, CD32 and IBA1 and (B, F, J) their relative fluorescence intensity in the cerebral cortex of the rats, determined by immunofluorescence staining. (C, G) mRNA expression of ARG1 and CD32 in the cerebral cortex of the rats, determined by real-time quantitative PCR. (D, H) protein expression of ARG1 and CD32 in the cerebral cortex of the rats, analyzed by Western blot. Scale = 50 μm. n=6 slices for each group for the fluorescence intensity calculation. n=6 for the PCR and Western blot assays. ***p < 0.001 compared with control group, #p < 0.05, ##p < 0.01, ###p < 0.001 compared with vincristine group. Data were shown as mean ± SD.
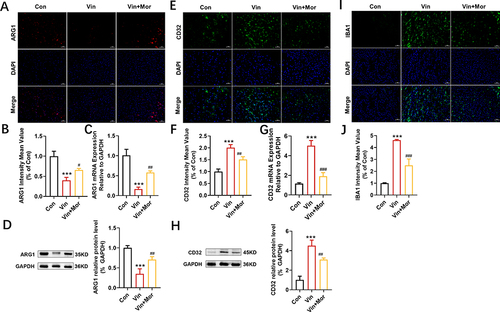
Figure 4 Effect of morin on NF-κB in neuropathic pain rat cerebral cortex. (A) Representative images of NF-κB P65 in cerebral cortex of rats in each group. (B) Relative P65 fluorescence intensity in each group. (C) mRNA and (D) protein expression of NF-κB P65 in each group. n=6 slices for each group for the fluorescence intensity calculation. n=6 for the PCR and Western blot assays. *p < 0.05 compared with control group, #p < 0.05 compared with vincristine group. Data were shown as mean ± SD.
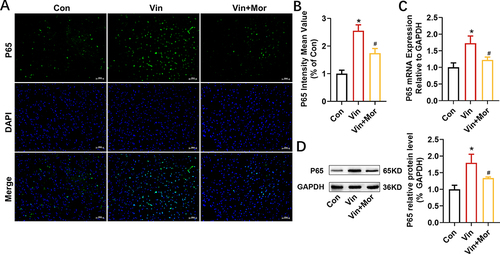
Figure 5 Morin affects microglia M1/M2 polarization by regulating NF-κB signaling. (A, E, I, M) Immunofluorescence staining for ARG1, CD32, P65 and IBA1 in cerebral cortex of rats in each group. Scale = 50 μm. (B, F, J, N) Relative ARG1, CD32, P65 and IBA1 fluorescence intensity in each group. (C, G, K) mRNA expression of ARG1, CD32, P65 in cerebral cortex of rats in each group, determined by real-time quantitative PCR. (D, H, L) Protein expression of ARG1, CD32, P65 in cerebral cortex of rats in each group, determined by Western blot. n=6 slices for each group for the fluorescence intensity calculation. n=6 for the PCR and Western blot assays. ***p < 0.001 compared to control group, ##p < 0.01 and ###p < 0.001 compared to vincristine group, &p < 0.05, &&p < 0.01, &&&p < 0.001 compared to group V+M group. Data were shown as mean ± SD.
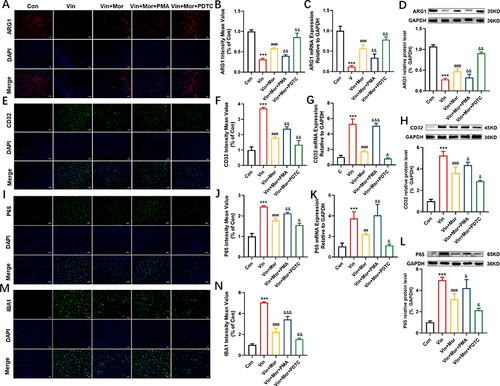
Figure 6 Effect of NF-κB regulation by morin on pain behavior. (A and B) MWT and TWL changes in each group. (C) The concentration changes of pro-inflammatory factors and anti-inflammatory factors in cerebral cortex of rats in each group. n=6 rats for each group. ***p < 0.001 compared with control group; ###p < 0.001 compared with vincristine group; &p < 0.05, &&p < 0.01, &&&p < 0.001 compared with vincristine+morin group. Data were shown as mean ± SD.
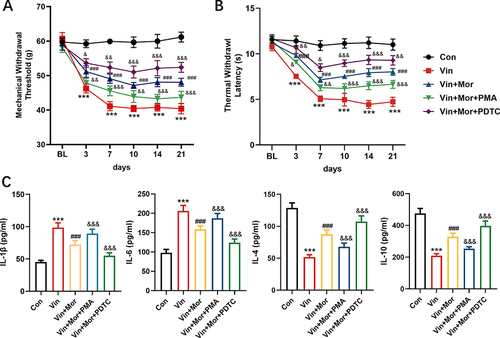
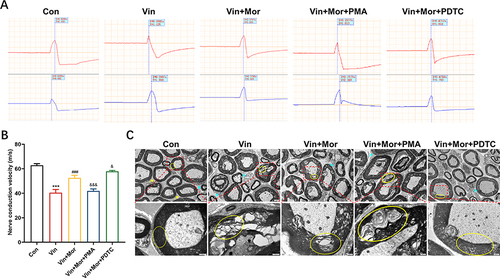
Figure 7 Morin alleviates vincristine-induced nerve injury by regulating NF-κB. (A and B) Changes in sciatic nerve conduction velocity in each group. n=6 rats for each group. Data were shown as mean ± SD. Upper and down panels represented the action potentials recorded at the near-end and far-end of the sciatic nerve, respectively. ***p < 0.001 compared with control group, ###p < 0.001 compared with vincristine group, &p < 0.05 and &&&p < 0.001 compared with vincristine+morin group. (C) Representative images of rat sciatic nerve transmission electron microscope (yellow ↑, ○: myelin sheath, cyan ↑: Schwann cells).