
Figures & data
Figure 1 Study design diagram.
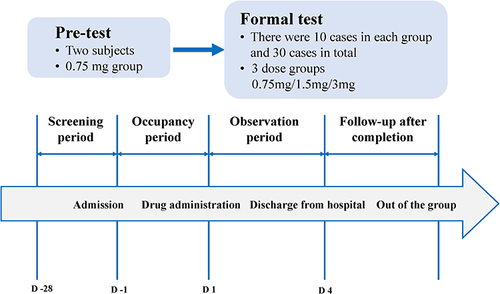
Figure 2 Flow chart of participant distribution.
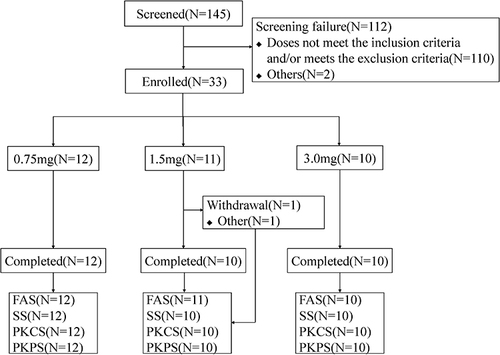
Table 1 Demographic Data and Baseline Characteristics of the Study Participants (mean±SD)
Figure 3 Mean plasma concentration–time curves. (a) Mean plasma concentration-time plot (Mean+SD) (b) Semilogarithmic scale diagram (Mean+SD) (c) Mean plasma concentration-time plot (0–1h) (Mean+SD) (d) semilog scale diagram (0–1h) (Mean+SD) (e) Mean plasma concentration-time plot (0–4h) (Mean+SD) (f) semilog scale diagram(0–4h) (Mean+SD).
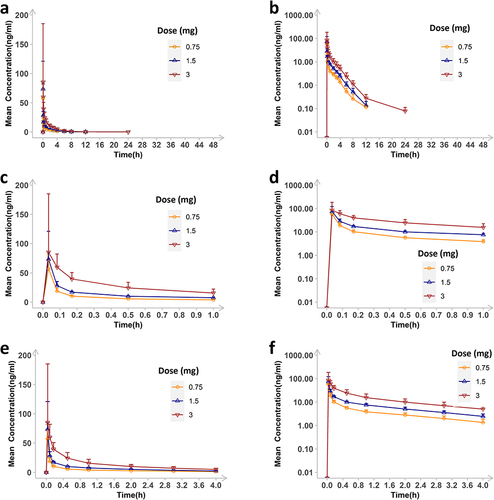
Table 2 Oliceridine Pharmacokinetic Parameters (GeoMean (CV%) or Median (Min, Max))
Table 3 Analysis of Dose-Proportionality
Figure 4 Main PK parameters versus dose. (a) Dose(mg) versus Cmax(ng/mL) (b) Logarithmic plot of dose versus Cmax (c) Dose(mg) versus AUC0-t(ng/mL) (d) Logarithmic plot of dose versus AUC0-t (e) Dose(mg) versus AUC0-∞(ng/mL) (f) Logarithmic plot of dose versus AUC0-∞.
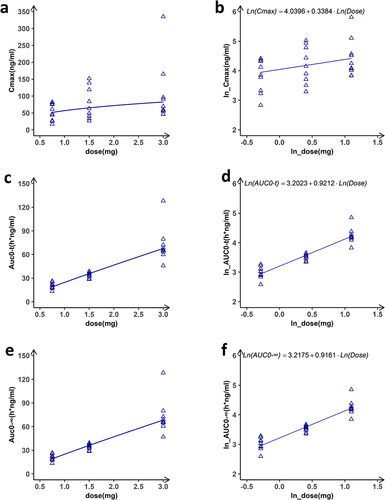
Table 4 Contrast of PK Parameters in the 1.5 Mg Group Between This and Previous Studies (GeoMean)
Table 5 Contrast of PK Parameters in the 3.0 Mg Group Between This and Previous Studies (GeoMean)
Table 6 Comparison of PK Blood Collection Time Points
Table 7 Comparison of “Time 0” PK Blood Collection Time Point Between This and Previous Studies
Table 8 Treatment-Emergent Adverse Events
Data Sharing Statement
The clinical raw data in this paper will be available upon reasonable request through an e-mail to the corresponding author (Guoping Yang).