Figures & data
Figure 1 Effects of CRD on escape latency and number of times crossing platforms in 3×Tg-AD mice. (A) Before administration, (B) 1 month after administration, (C) 2 month after administration, (D) 3 month after administration. Data are expressed as the mean from 8 mice per group, ##p<0.01 versus the WT group; *p<0.05, **p<0.01 versus the Model group.
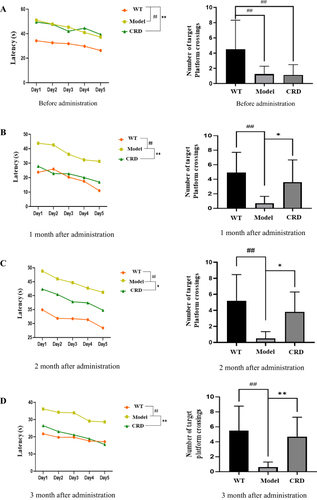
Figure 2 CRD repaired hippocampal neuronal damage in 3×Tg-AD mice. (A) HE staining showed the pathological changes of DG region in hippocampal tissue of mice in each group (n=6, Scale bar=50μm). (B) Nissl staining showed the pathological changes of CA1 region in hippocampal tissue of mice in each group (n=6, Scale bar=50μm). (C) Effect of CRD on levels of IL-1β in 3×Tg-AD mice serum. (D) Effect of CRD on levels of TNF-α in 3×Tg-AD mice serum. Data are presented as the mean ± SD (n=6), ##p<0.01 versus the WT group; **p<0.01 versus the Model group.
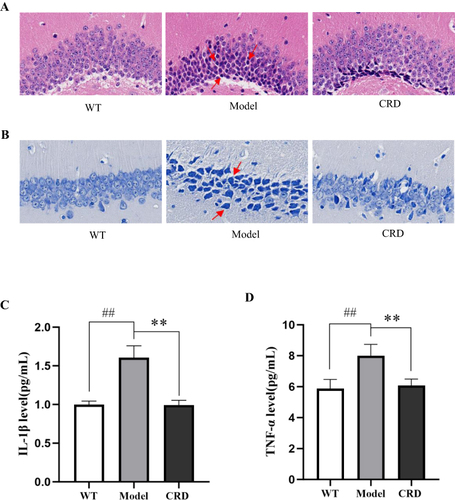
Figure 3 Effect of CRD on activation of microglia in hippocampus and cortex of mice. (A) The expression of Iba-1 in the hippocampus and cortex of mice (Scale bar=20μm). (B) The expression of CD86 in the hippocampus and cortex of mice (Scale bar=20μm). Data are presented as the mean ± SD (n=5), ##p<0.01 versus the WT group; **p<0.01 versus the Model group.
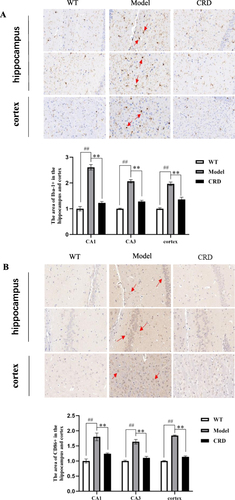
Figure 4 QC of UHPLC-MS/MS analysis. (A) TIC (POS), (B)TIC (NEG); (C) Two-dimensional PCA for QC, (D) Three-dimensional PCA for QC.
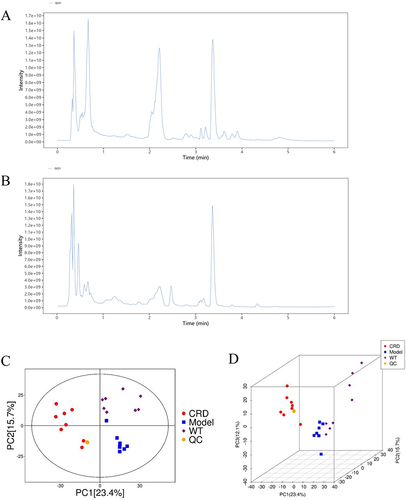
Figure 5 Multivariate analysis of serum metabolomics. (A) PCA (WT vs Model), (B) PCA (Model vs CRD); (C) OPLS-DA (WT vs Model), (D) OPLS-DA (Model vs CRD); (E) statistical validation of OPLS-DA (WT vs Model), (F) statistical validation of OPLS-DA (Model vs CRD).
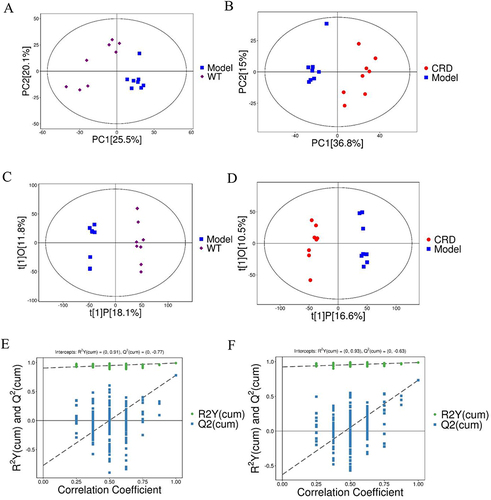
Table 1 Identification of Potential Biomarkers in Serum of Mice in WT Group, Model Group and CRD Group
Figure 6 Volcano plot for the differentially expressed metabolites. (A) WT vs Model, (B) Model vs CRD. (C) Venn diagram of metabolites in different comparison groups. (D) KEGG pathway enrichment map of differential metabolites.
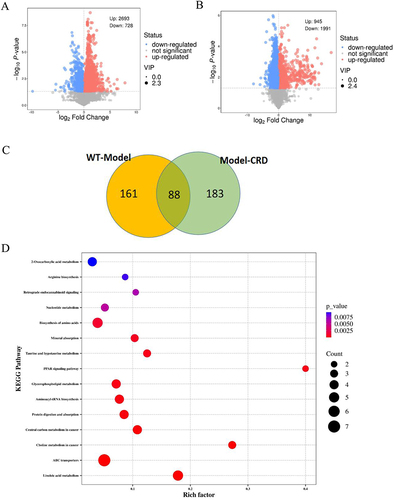
Figure 7 Effect of CRD-containing serum on BV2 microglia cells viability. (A) Effects of the Normal rat serum on BV2 microglia cells viability. Data are presented as the means ± SD (n=6). (B) Effects of the CRD-containing and the Donepezil-containing serum on BV2 microglia cells viability. Data are presented as the mean ± SD (n=6). **p<0.01 versus the 10% Normal serum.
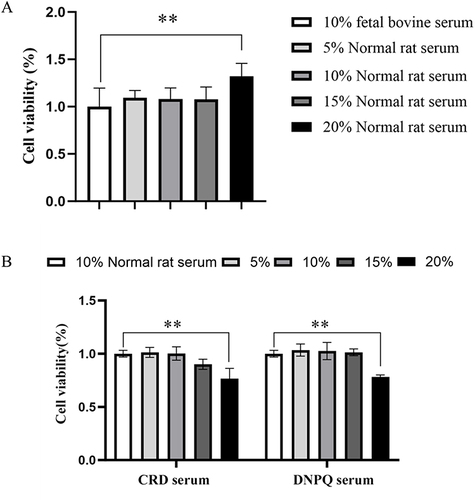
Figure 8 Effects of LPS on expression of Iba-1, CD86 and NF-κB p65 in BV2 microglia cells. (A) The expression of Iba-1 in LPS-induced BV2 microglia was detected by immunofluorescence assay (Scale bar=200μm). (B) The expression of CD86 in BV2 microglia cells induced by LPS was measured via flow cytometry. (C) The protein expression of NF-κB p65 in BV2 microglia cell nucleus induced by LPS were detected via Western blot analysis. Data are presented as the mean ± SD (n=5), **p<0.01 versus the 0 μg/mL LPS group.
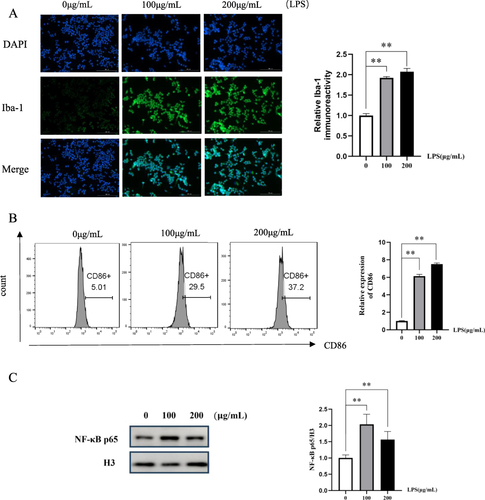
Figure 9 Effect of CRD-containing serum on the expression of Iba-1 in BV2 microglia cells. (A and B) Immunofluorescence analysis of Iba-1 proteins in BV2 microglia cells (Scale bar=200μm). Data are presented as the mean ± SD (n=6), ##p<0.01 versus the control group; **p<0.01 versus the LPS group.
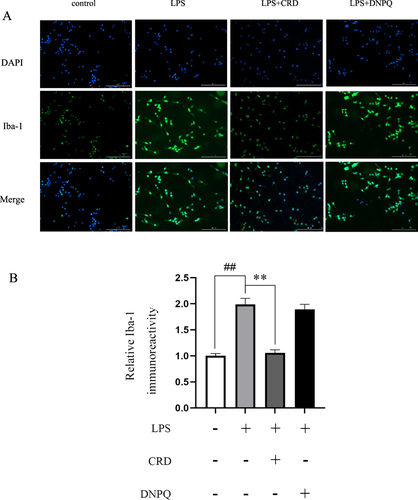
Figure 10 Effect of CRD-containing serum on the expression levels of iNOS and COX-2 protein in BV2 microglia cells. (A) Western blot analysis of protein expression in BV2 microglia cells, the expression levels of (B) iNOS and (C) COX-2. Data are presented as the mean ± SD (n=5), ##p<0.01 versus the control group; **p<0.01 versus the LPS group.
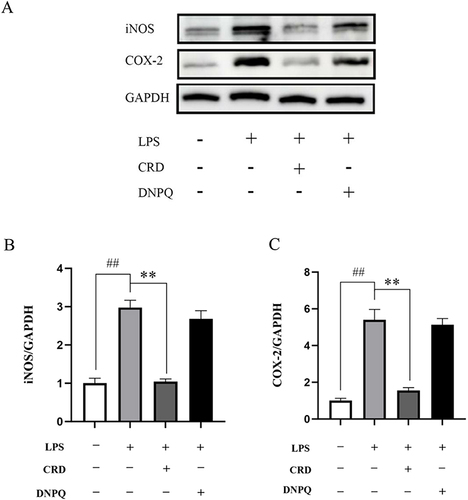
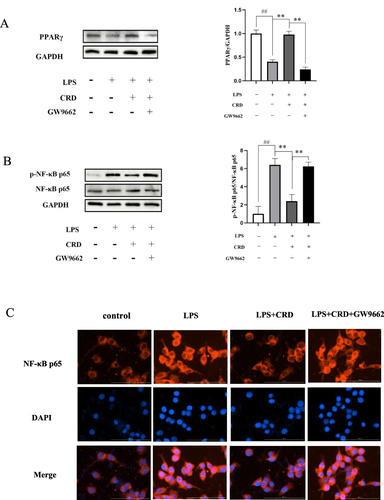
Figure 11 Effect of CRD-containing serum on PPARγ/NF-κB pathway. (A) The protein expression level of PPARγ in BV2 microglia cells was determined by Western blotting. (B) The protein expression level of NF-κB p65 and p-NF-κB p65 in BV2 microglia cells was determined by Western blotting. Data are presented as the mean ± SD (n=5), ##p<0.01 versus the control group; **p<0.01 versus the CRD group. (C) Immunofluorescence analysis of p65 proteins in BV2 microglia cells (Scale bar=100μm).