Figures & data
Figure 1 Identification of biochemical components in TZP using UPLC-Q-TOF-MS. Typical Total Ion Chromatogram (TIC) in positive (A) and negative (B) modes. Components: 1. Mulberroside A; 2. Daidzin; 3. Puerarin; 4. 3’-Methoxypuerarin; 5. Daidzein; 6. Chrysophanic acid; 7. Rhein; 8. Aloeemodin; 9. Rosmarinic acid; 10. Columbamine; 11. Epiberberine; 12. Coptisine; 13. Salvianolic acid B; 14. Palmatine; 15. Berberine; 16. Emodin; 17. Kaempferol; 18. Cryptotanshinone; 19. Kuwanon G; 20. Jatrorrhizine.
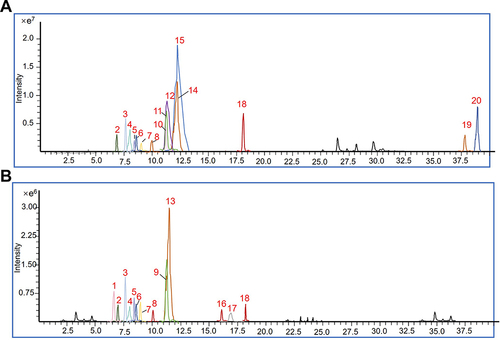
Figure 2 The effects of TZP on body weight, fat tissue weight and adipose tissue histology in prediabetic mice. (A) Experimental Design. (B) Comparison of body weight among mice in diverse groups (n = 8). (C) Measurement of fat mass and lean mass using whole-body echo MRI analysis (n = 6–8). (D) Hematoxylin and Eosin (HE) staining of Epididymal White Adipose Tissue (EWAT) with a magnification of ×200 and ×400 (n = 5). (E) Adipocyte size measured using Image-Pro-Plus. *p < 0.05 and ***p < 0.001 vs Con group; #p < 0.05, ##p < 0.01, ###p < 0.001 vs pre-DM group; †p < 0.05 vs Met group.
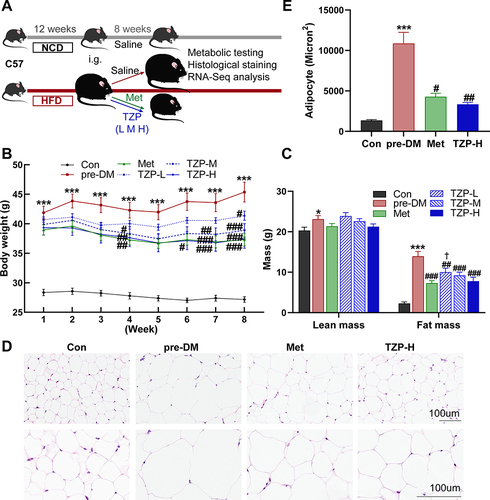
Figure 3 TZP restores glucose tolerance and ameliorates insulin resistance in prediabetic mice. (A) Glucose tolerance was assessed through a Glucose Tolerance Test (GTT) at 8 weeks, (B) with the calculation of the Area Under the Curve (AUC) (n = 4). (C) An Insulin Tolerance Test (ITT) was performed at 7 weeks, (D) and the AUC of ITT was computed accordingly (n = 4). (E) Evaluations included measurements of Fasting Blood Glucose (FBG) (n = 6), (F) serum insulin levels (n = 6), (G) and the Homeostatic Model Assessment of Insulin Resistance (HOMA-IR) index (n = 6). ***p < 0.001 vs Con group; #p < 0.05, ##p < 0.01, ###p < 0.001 vs pre-DM group; †p < 0.05 vs Met group.
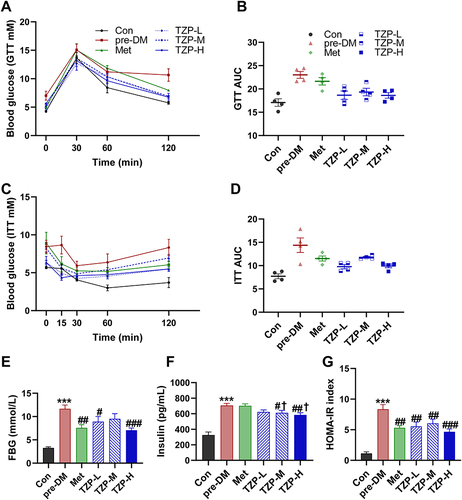
Figure 4 Improved Serum Lipid Metabolism and Hepatic Steatosis by TZP in Prediabetic Mice. (A) Serum alterations in Total Cholesterol (TC) (n = 6), (B) Triglycerides (TG) (n = 6), (C) low-density lipoprotein (LDL) (n = 6), (D) high-density lipoprotein (HDL) (n = 6), and (E) Free Fatty Acids (n = 6) for each group were assessed, (F) along with hepatic TG levels (n = 5). (G) Representative images of H&E staining and Oil Red O staining are presented. *p < 0.05 and ***p < 0.001 vs Con group; #p < 0.05, ##p < 0.01, ###p < 0.001 vs pre-DM group; †p < 0.05 vs Met group.
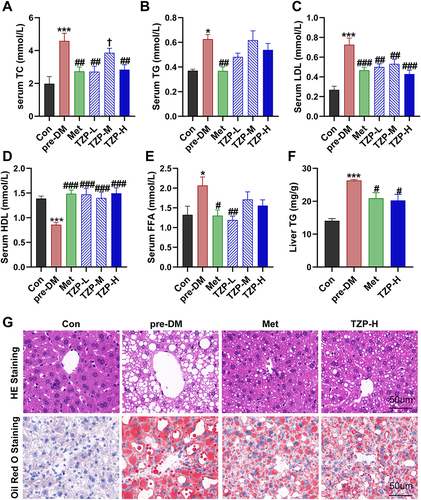
Figure 5 TZP enhances energy expenditure. (A and B) VO2, (C and D) VCO2, (E and F) EE levels were measured using an indirect calorimeter. n = 3.
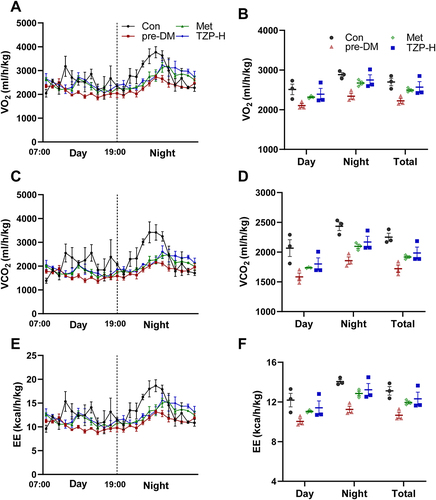
Figure 6 DEGs regulated by TZP. (A) Volcano plots of differentially expressed genes (DEGs) in pre-DM/Con and TZP/pre-DM. (B) 1140 down-regulated and 643 up-regulated DEGs by treatment with TZP. (C) Heatmap of 1783 crossed-differently expressed genes in the three groups.
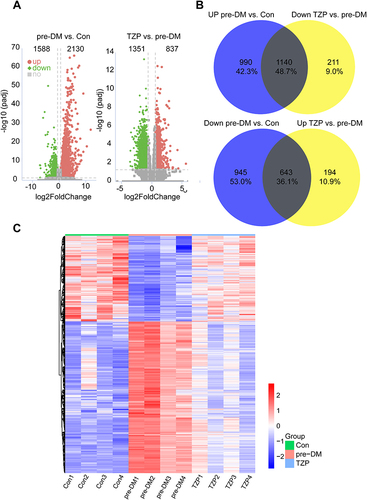
Figure 7 Enrichment results of DEGs. (A and B) GO and KEGG annotations of common DEGs from the comparison of TZP downregulation vs pre-DM (red, down-regulated). (C and D) KEGG and GO annotations of common DEGs from the comparison of TZP upregulation vs pre-DM (blue, up-regulated). (E) Heatmap of prediabetes-related DEGs for the three experimental groups.
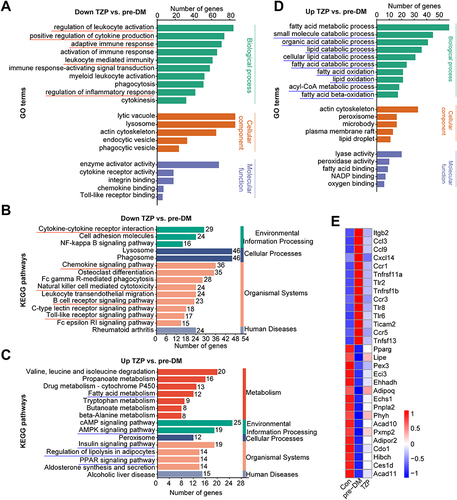
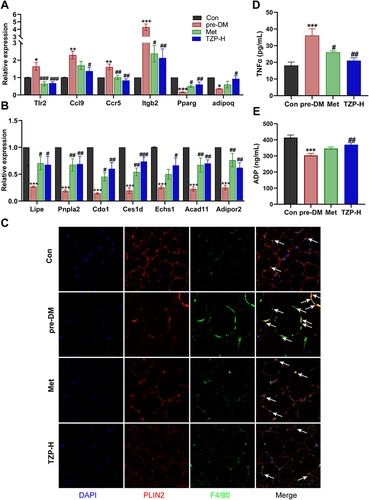
Figure 8 Effects of TZP on mRNA levels of inflammation- and catabolism-related DEGs and proteins. (A and B) RT-PCR validation of the specific DEGs (n = 5). (C) Images of EWAT stained by immunofluorescent staining in different groups (the arrow indicates the location of the crown-like structure). (D) serum Tumor Necrosis Factor-alpha (TNFα) level (n = 6); (E) serum adiponectin (ADP) level (n = 6). *p < 0.05, **p < 0.01, and ***p < 0.001 vs Con group; #p < 0.05, ##p < 0.01, ###p < 0.001 vs pre-DM group.