Figures & data
Figure 1 Pathological section of tumor formed 3 weeks after the inoculation of Tca8113 cells into the cheek of nude mice (hematoxylin and eosin stain, ×200).
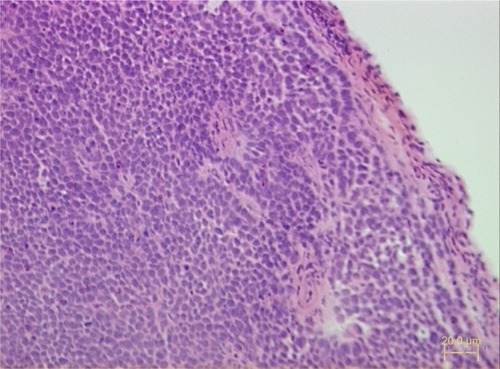
Table 1 Drug efficacy and adverse reactions in control and experimental tumor-bearing mice 7 days after L-OHP injection
Figure 2 Cosine fitting curve of the survival times of tumor-bearing mice injected with L-OHP at four different time points.
Notes: The segment of hatched bar on the x axis represents activity phase. The four points in the figure represent the average survival time in each group (n = 15) of tumor-bearing mice that received L-OHP at 4, 10, 16, 22 HALO in a day. The points represent the means, and bars represent standard deviation; the comparison between multiple means was performed with analysis of variance, F = 15.02, P < 0.001; circadian rhythm was tested with cosine analysis, F = 12.47, P < 0.001.
Abbreviations: L-OHP, oxaliplatin; HALO, hours after light onset.
Abbreviations: L-OHP, oxaliplatin; HALO, hours after light onset.
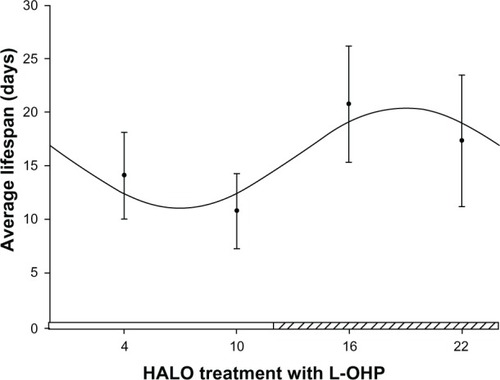
Figure 3 Cosine fitting curve of the WBC counts of tumor-bearing mice injected with L-OHP at four different time points.
Notes: The segment of hatched bar on the x axis represents activity phase. The four points in the figure represent the average WBC counts in each group (n = 15) of tumor-bearing mice at 22 HALO 7 days after L-OHP injection at 4, 10, 16, 22 HALO in a day. The points represent the means, and bars represent standard deviation; the comparison between multiple means was performed with analysis of variance, F = 292.21, P < 0.001; circadian rhythm was tested with cosine analysis, F = 100.25, P = 0.00.
Abbreviations: L-OHP, oxaliplatin; HALO, hours after light onset; WBC, white blood cell.
Abbreviations: L-OHP, oxaliplatin; HALO, hours after light onset; WBC, white blood cell.
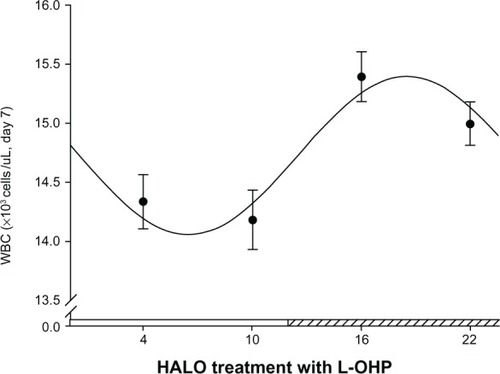
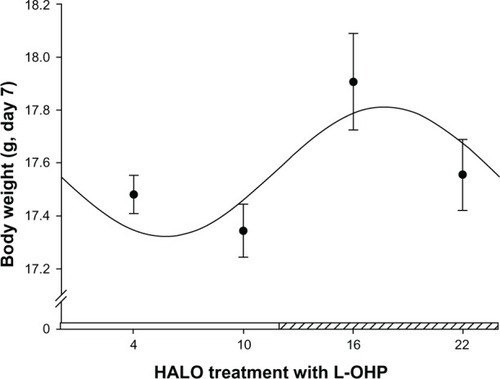
Figure 4 Cosine fitting curve of the body weights of tumor-bearing mice injected with L-OHP at four different time points.
Notes: The segment of hatched bar on the x axis represents activity phase. The four points in the figure represent the average body weight in each group (n = 15) of tumor-bearing mice at 22 HALO 7 days after L-OHP injection at 4, 10, 16, 22 HALO in a day. The points represent the means, and bars represent standard deviation; the comparison between multiple means was performed with analysis of variance, F = 51.87, P < 0.001; circadian rhythm was tested with cosine analysis, F = 24.61, P = 0.00.
Abbreviations: L-OHP, oxaliplatin; HALO, hours after light onset.
Abbreviations: L-OHP, oxaliplatin; HALO, hours after light onset.