
Figures & data
Figure 1 The proven mechanism of action of catalpol and the proposed experiment. (By Figdraw).
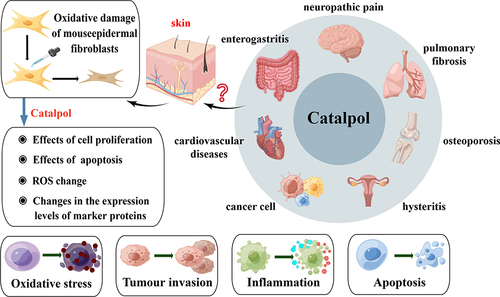
Figure 2 H2O2-induced oxidative damage cell model and effect of catalpol on viability of cell model with oxidative damage. (A) CCK8 assay for evaluating the effect of catalpol on L929 cell proliferation. (B) Assessment of oxidative damage on L929 cells with H2O2 treated. (C) CCK8 assay evaluating protective effects of catalpol on H2O2 treated L929 cells. (D) IC50 values of H2O2 in L929 cells. Data are presented as the average of repeated samples, with error bars representing standard deviations. *p <0.05. (E) The cell proliferation ability of L929 cells which were pretreatment with NAC and different concentrations of catalpol in H2O2 induced oxidative stress model for 24 h, 48 h, 72 h.
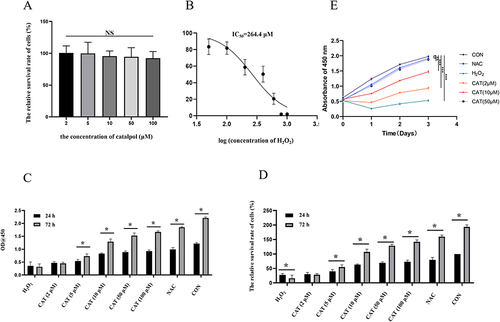
Figure 3 Effect of catalpol on apoptosis of model cells damaged by oxidation. Flow cytometry for evaluating the effect of catalpol on apoptosis in H2O2 treated L929 cells.
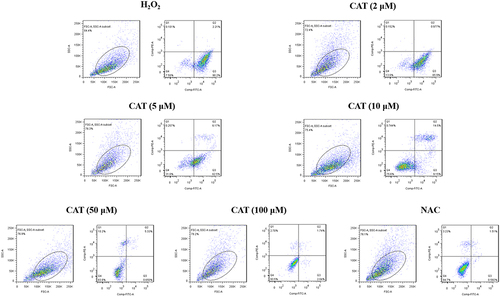
Figure 4 Effects of catalpol on ROS in L929 cells damaged by oxidation. (A and B) Flow cytometric analysis of the ROS production in L929 cells with different treatments. (C) Quantitative analysis of DCFH-DA accumulation by FACS. Data are presented as the average of repeated samples, with error bars representing standard deviations. *p <0.05, #p <0.05.
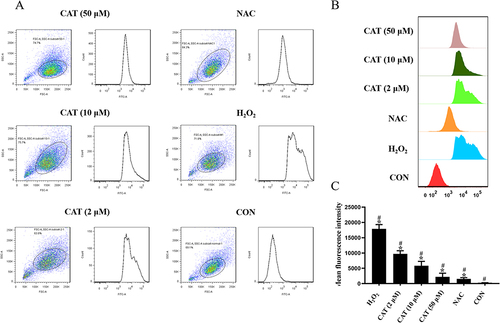
Figure 5 (A) Effects of catalpol on MDA in L929 cells damaged by oxidation. (B) Effects of catalpol on SOD in L929 cells damaged by oxidation. (C) Effects of catalpol on GSH in L929 cells damaged by oxidation. *p <0.05, **p <0.01, ***p <0.001.
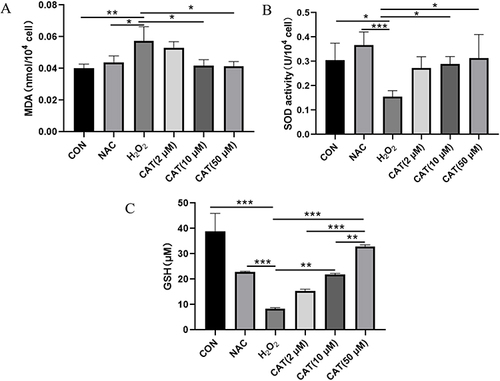
Figure 6 Effects of catalpol on oxidative damage of L929 cell marker protein and Nrf2/HO-1 pathway protein. (A) Western blot analyzed Nrf2, HO-1, α-SMA and S100A4 expression in H2O2-treated L929 cells which were pretreatment with NAC and different concentrations of catalpol for 24 hours. (B) Statistical analysis of Nrf2, HO-1, α-SMA and S100A4 expression in H2O2-treated L929 cells which were pretreatment with NAC and different concentrations of catalpol for 24 hours. Data are presented as the average of repeated samples, with error bars representing standard deviations. *p <0.05, **p <0.01, ***p <0.001.
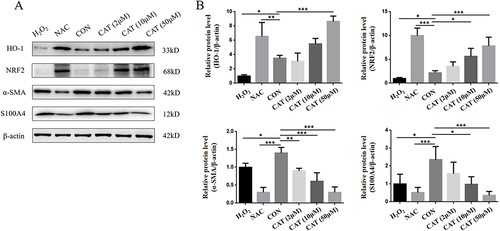
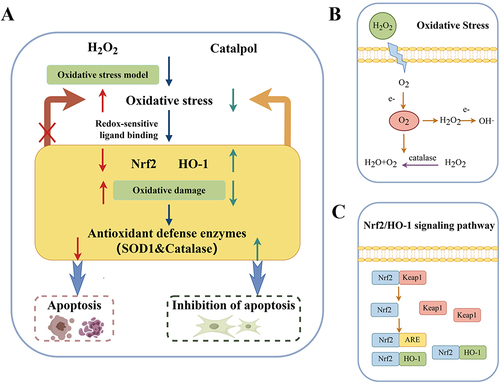
Figure 7 (A) Mechanism diagram of catalpol obtained by experiment; (B) Relationship between OS and H2O2. (C) Schematic diagram of Nrf2/HO-1 signaling pathway.
Data Sharing Statement
All the data in the article are obtained by the authors themselves, and the pictures are also drawn by themselves. So no reference to any data set, all original. Six samples were prepared for each data, and the repeated experiment of each sample was carried out as a separate and independent experiment.