
Figures & data
Figure 1 Study flow chart.
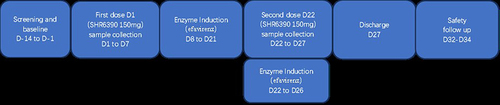
Table 1 Plasma Pharmacokinetic Parameters of SHR6390 Following Monoadministration and Coadministration with Efavirenz
Table 2 Treatment Ratio Geometric Mean Ratios (GMR, SHR6390+efavirenz versus SHR6390 Alone) with 90% Confidence Interval for SHR6390
Figure 2 The linear and semilogarithmic scales of mean plasma concentration-time curves after subjects received a single dose (150 mg) of SHR6390 orally and together with 600 mg efavirenz. ![]()
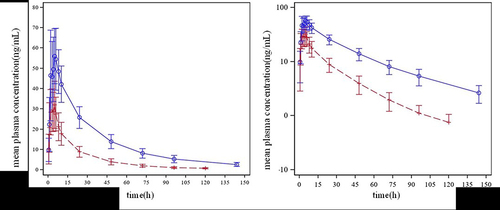
Table 3 Summary of Adverse Events After the Study Drug Administration
Data Sharing Statement
The data that support the findings of this study are not available due to confidentiality.