Figures & data
Table 1 Chemical structures and biological data of 42 tricyclic phthalimide HIV-1 integrase inhibitors
Table 2 Summary of hologram quantitative structure–activity relationship (HQSAR) statistical indexes for the influence of various fragment distinctions (FD), using 4–7 as the fragment size parameter
Figure 1 Selected atoms to alignment I (A) and three-dimensional (3D) view of superimposed aligned molecules (B). Selected atoms to alignment II (C) and 3D view of superimposed aligned molecules (D).
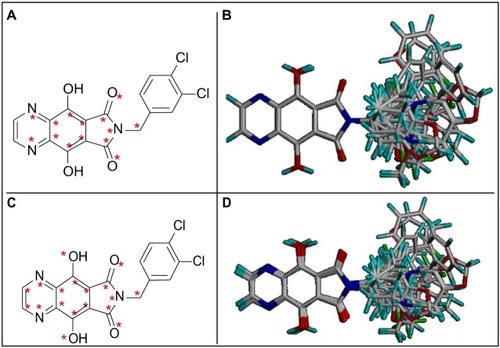
Table 3 Summary of hologram quantitative structure–activity relationship statistical indexes for the influence of various fragment sizes (FS), using atoms (Models 16–21); bonds and connectivity (Models 22–27); or atoms, bonds, and connectivity (Models 28–33) as the fragment distinction parameter
Table 4 Comparative molecular field analysis for alignments I and II using Tripos standard and indicator force fields with a lattice spacing of 2 Å
Table 5 Comparative molecular field analysis for alignment II using lattice spacing of 1 Å and Csp 3 (+1) as the probe atom
Figure 2 The hologram quantitative structure–activity relationship contribution maps of the most (33) and least (8) potent HIV-1 integrase inhibitors.
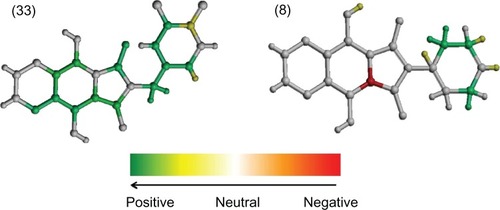
Figure 3 Comparative molecular field analysis contour maps for steric field with the most (33; A) and least (8; B) active compounds.
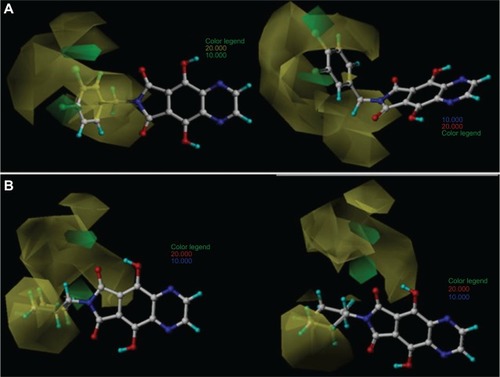
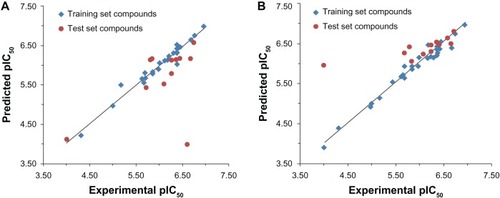
Table 6 Experimental and predicted pIC50 values of training and test set compounds
Figure 4 Plot of experimental versus predicted pIC50 values of the training and test sets of the tricyclic phthalimide HIV-1 integrase inhibitors by comparative molecular field analysis (A) and hologram quantitative structure–activity relationship (B).