Figures & data
Table 1 Effect of mannitol concentration and inlet air temperature on percentage yield and particle size of spray dried powders (mean ± SD, n = 3)
Figure 1 Scanning electron micrographs of sCT-CS-NPs spray dried powders using different nanoparticles/mannitol ratios (NPs/M) and inlet temperatures. (A) NPs/M = 10/90, (B) NPs/M = 20/80, (C) NPs/M = 30/70 all prepared at 110°c, (D) NPs/M = 10/90, (E) NPs/M = 20/80, (F) NPs/M = 30/70 all prepared at 130°c and (G) NPs/M = 10/90, (H), NPs/M = 20/80, (I) NPs/M all prepared at 150°c.
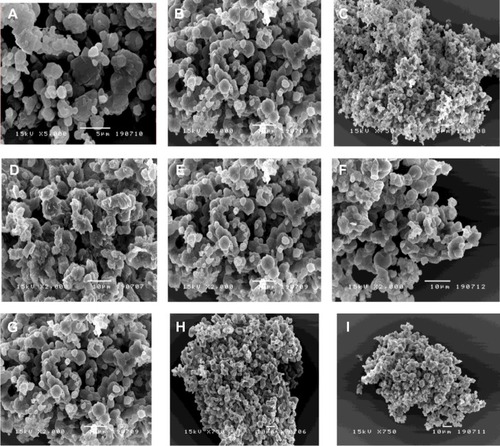
Table 2 Densities and aerodynamic diameter of dry powders prepared using different mannitol concentrations and inlet air temperatures (mean ± SD, n = 3)
Figure 2 (A) SDS-PAGE analysis of l1: sCT standard marker, L2: unprocessed sCT (0.1 μg/ml), L3, L4, and L5: sCT recovered from sCT-CS-NPs spray dried powders (NPs/M = 30/70), prepared at the inlet temperatures of 110°c, 130°c, and 150°c, respectively, L6: blank spray dried powder, and L7: sample buffer. (B) SDS-PAGE analysis of L1: sCT standard marker, L2 and L3: unprocessed sCT (0.2 and 0.1 μg/mL), L4, L5, and L6: sCT recovered from sCT-CS-NPs spray dried powders with NPs/M = 10/90, NPs/M = 20/80, and NPs/M = 30/70, respectively, when prepared using an inlet temperature of 130°C, L7: blank spray dried powder and l8: sample buffer.
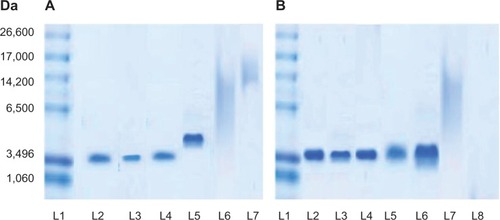
Figure 3 sCT circular dichroism spectra in acetate buffer pH 4.4 of: (◆) native sCT, (■) sCT-CS-NPs compared to sCT-CS-NPs spray dried powders containing different sCT loaded CS-NPs/mannitol ratios of (▲) NPs/M = 30/70; (•) NPs/M = 20/80; and (X) NPs/M = 10/90 when using an inlet air temperature of 130°c.
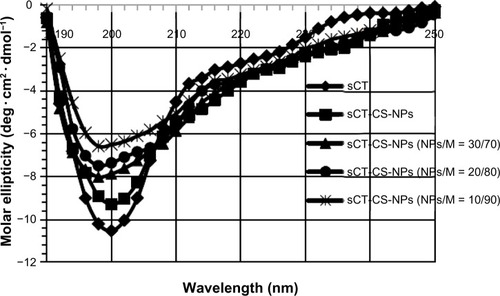
Figure 4 FTIR spectra of: (A) native sCT, (B) chitosan, (C) mannitol, and sCT-CS-NPs spray dried powders of (D) NPs/M = 30/70, (E) NPs/M = 20/80, (F) NPs/M = 10/90 prepared using an inlet temperature of 130°c.
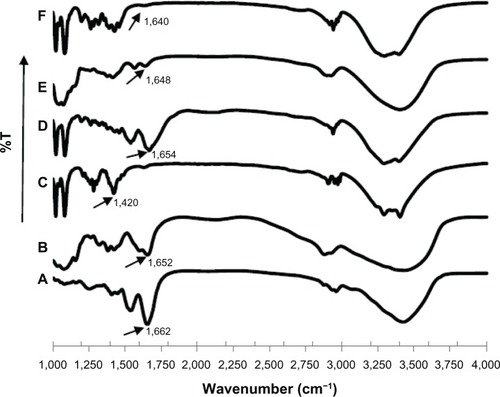
Table 3 Size and zeta potential of freshly prepared sCT-CS-NPs and nanoparticles recovered from spray dried powders (mean ± SD, n = 3)
Figure 5 TEM of (A) freshly prepared nanoparticles and (B) recovered nanoparticles from spray dried powder (NPs/M = 30/70) prepared at an inlet temperature of 130°C.
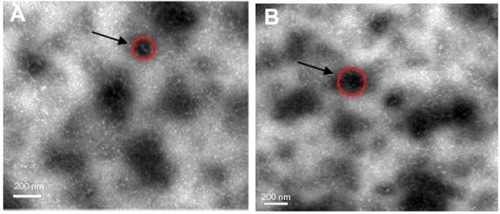
Figure 6 In vitro release profile of sCT-CS-NPs and sCT-CS-NPs spray dried powders (NPs/M = 30/70) prepared using an inlet air temperature of 130°C.
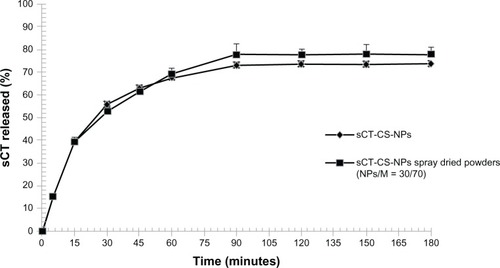
Table 4 Mass median aerodynamic diameter, fine particle fraction, emitted dose and dispersibility of sCT-CS-NPs spray dried powders determined with ACI (mean ± SD, n = 3)
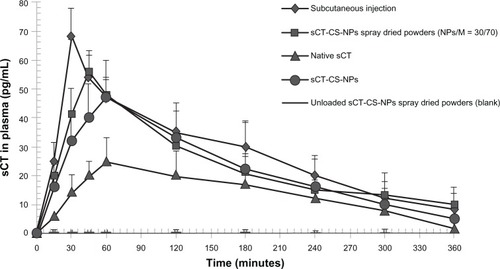
Table 5 Pharmacokinetic parameters (mean ± SD, n = 6)
Figure 7 Plasma sCT concentration versus time profiles following intratracheal administration of native sCT, sCT-CS-NPs, sCT-CS-NPs spray dried powders and CS-NPs spray dried powders (blank, without loading sCT) compared to subcutaneous administration in rats; mean ± SD (n = 6).