Figures & data
Figure 1 Comparison of control levels of NAE 16:0 in various tissues of DBA/2 mice.
Notes: (A) Functional or (B) metabolic effect of depot injections 24 and 48 hours following administration, showing NAE 16:0 levels per g FW or g LM, respectively. Data within treatment groups or comparing control levels (bars) were statistically analyzed using a one-way ANOVA with a Dunnett’s or Bonferroni posttest, respectively. Data represented as Mean ± standard error of the mean, n = 3–4. *P < 0.05, **P < 0.01, ***P < 0.001.
Abbreviations: FW, fresh weight; LM, lipid mass; NAE 16:0, N-Palmitoyl-ethanolamine.
Abbreviations: FW, fresh weight; LM, lipid mass; NAE 16:0, N-Palmitoyl-ethanolamine.
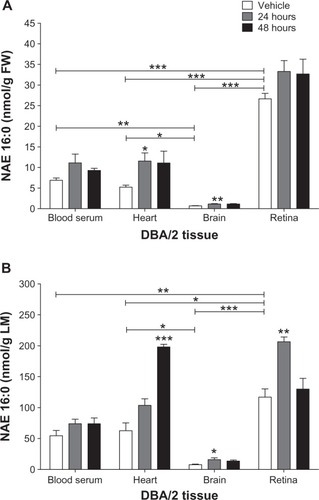
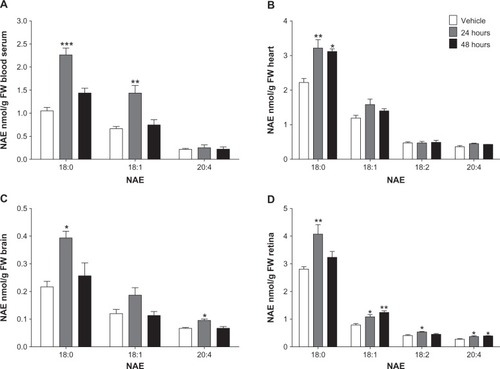
Figure 2 Elevation above control levels of NAE 18:0, 18:1, 18:2, and 20:4, 24 and 48 hours following NAE 16:0 depot injection.
Notes: Depot injection in (A) blood serum, (B) heart (C) brain, and (D) retina of DBA/2 mice. Data were statistically analyzed using a one-way analysis of variance (ANOVA) with a Dunnett’s post test. *P < 0.05, **P < 0.01. Mean ± standard error of the mean, n = 3–4.
Abbreviations: FW, fresh weight; NAE, N-Acylethanolamine; NAE 16:0, N-Palmitoylethanolamine.
Abbreviations: FW, fresh weight; NAE, N-Acylethanolamine; NAE 16:0, N-Palmitoylethanolamine.