Figures & data
Figure 1 Chemical structures of compounds 1, 2, and 3.
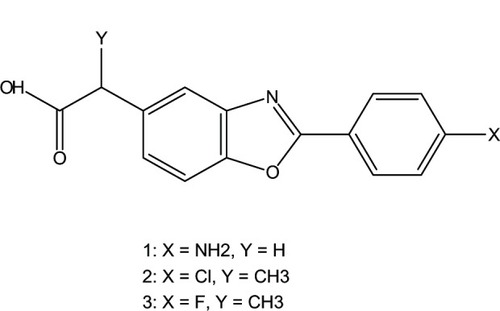
Figure 2 Synthesis of compound 1.
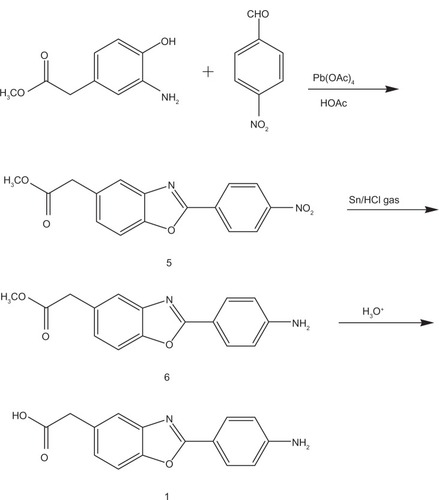
Figure 3 Chemical structure of compound 4.
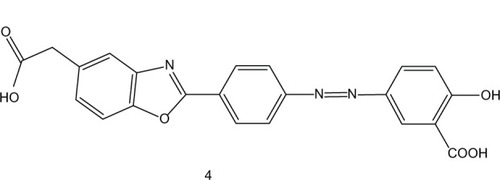
Figure 4 Synthesis of compound 2.
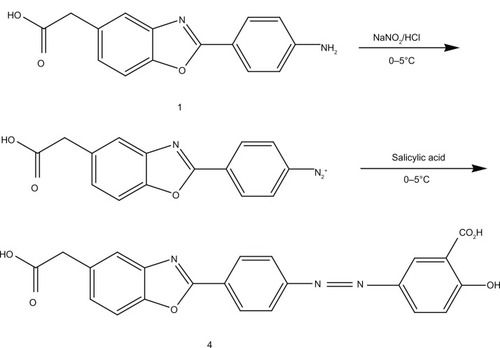
Table 1 Inflammation scores of synthesized prodrug-treated rat colons, by histopathological examination
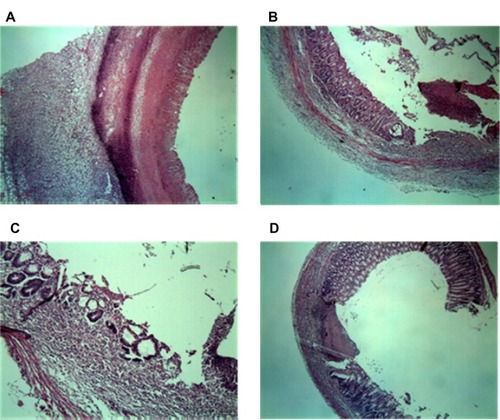
Figure 5 Representative histopathology pictures from rat colons treated with synthesized prodrugs: (A) a representative picture of group a (negative control) showing severe mucosal and transmural inflammation, in addition to increased wall thickness; (B) a representative picture of group B (treated with 5-ASA), shows that mucosal inflammation and ulceration were minimal and no increase in wall thickness was present; (C) a representative picture of group C (treated with compound 4) showing mucosal ulceration with no transmural inflammation or increase of wall thickness; and (D) a representative picture of group D (treated with compound 1) shows mucosal ulceration with no transmural inflammation and that wall thickness was minimally increased.