Figures & data
Figure 1 Effect of DRz concentration on the expression of IGF-IIP3 in SMMC-7721 cells.
Abbreviations: DRz, deoxyribozyme (DNAzyme); DRz1inv, inactive DRz; IGF-IIP3, insulin-like growth factor II promoter 3; mRNA, messenger RNA; SD, standard deviation.
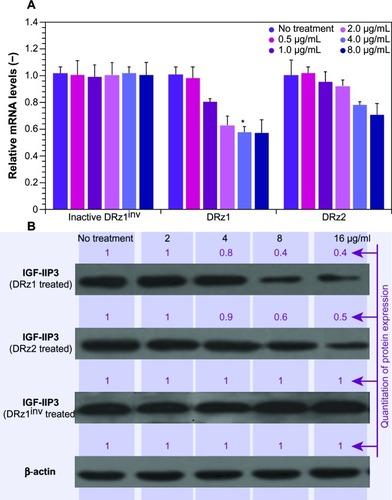
Figure 2 Effect of DRzs on the expression of IGF-IIP3 in SMMC-7721 cells.
Abbreviations: DRz, deoxyribozyme (DNAzyme); DRz1inv, inactive DRz; IGF-IIP3, insulin-like growth factor II promoter 3; mRNA, messenger RNA; SD, standard deviation.
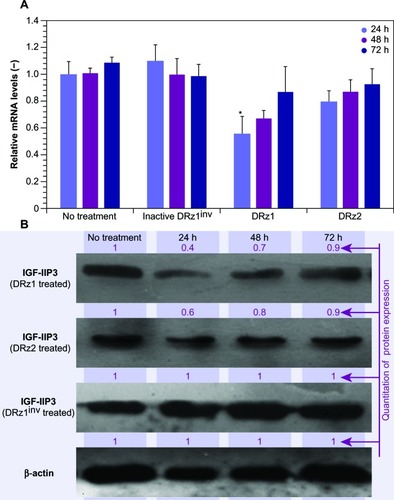
Figure 3 Fluorescence microscopic evaluation of DRz cellular uptake and intracellular distribution.
Abbreviations: Cells were transfected with 4 μg/mL (0.39 pmol/μL) DRz1, DRz2, or DRz1inv (control) and cultured for 24 hours to a final cell density of 2 × 10⁴. Bar: 200 μm.
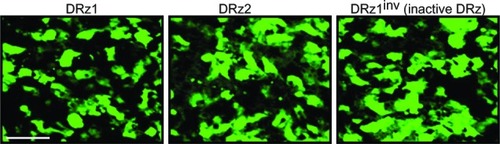
Figure 4 Effect of 4 μg/mL (0.39 pmol/μL) DRzs on the expression of IGF-IIP3 in various HCC cell lines.
Abbreviations: DRz, deoxyribozyme (DNAzyme); HCC, hepatocellular carcinoma; IGF-IIP3, insulin-like growth factor II promoter 3.
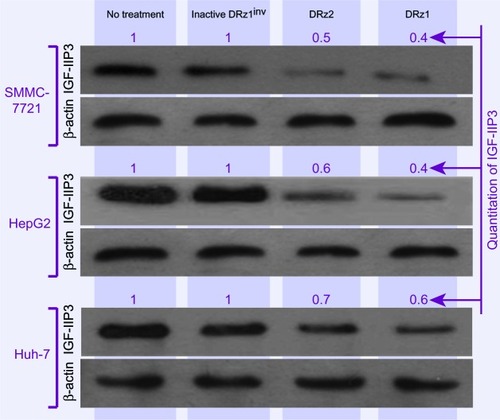
Figure 5 Assessment of cell proliferation via MTT assay.
Abbreviations: DRz, deoxyribozyme (DNAzyme); IGF-IIP3, insulin-like growth factor II promoter 3; MTT, 3-(4,5-dimethylthiazol-2-yl)-2,5-diphenyltetrazolium bromide; SD, standard deviation.
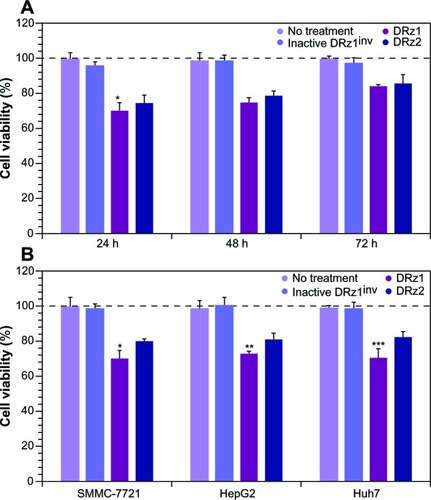
Figure 6 Fluorescence microscopic evaluation of nuclear morphological changes (DAPI stained) in response to IGF-IIP3 DRzs.
Abbreviations: DAPI, diamidino-phenylindole; DRz, deoxyribozyme (DNAzyme); DRz1inv, inactive DRz; IGF-IIP3, insulin-like growth factor II promoter 3.
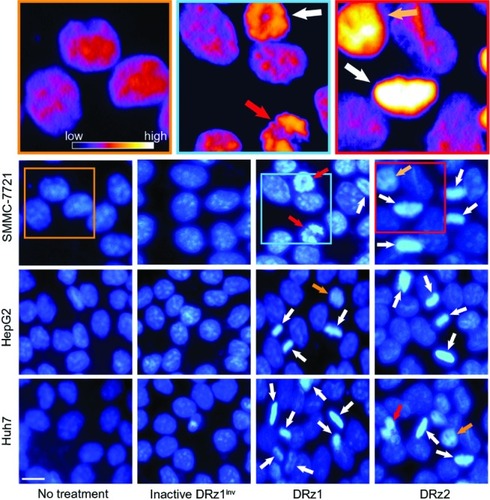
Figure 7 Representative flow cytometric assessment of apoptosis via annexin V and PI staining.
Abbreviations: DRz, deoxyribozyme (DNAzyme); FITC, fluorescein isothiocyanate; PI, propidium iodide.
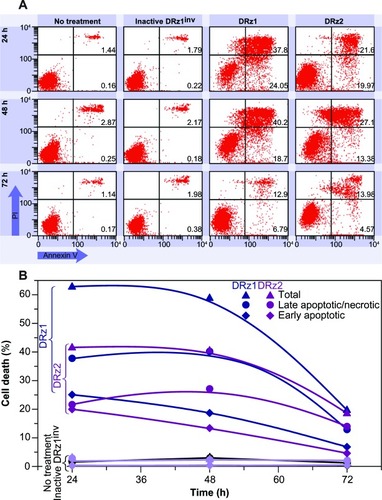
Figure 8 Representative flow cytometric assessment of apoptosis via annexin V and PI staining.
Abbreviations: HepG2 and Huh7 cells were treated with 4 μg/mL (0.39 pmol/μL) DRz1 and DRz2 and kept in culture for 24 hours (~105 cells were analyzed with flow cytometry).
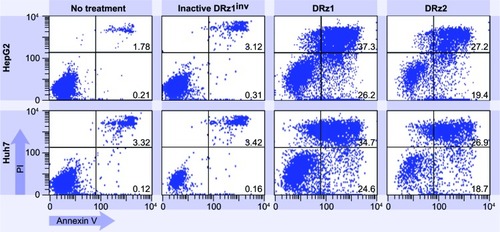
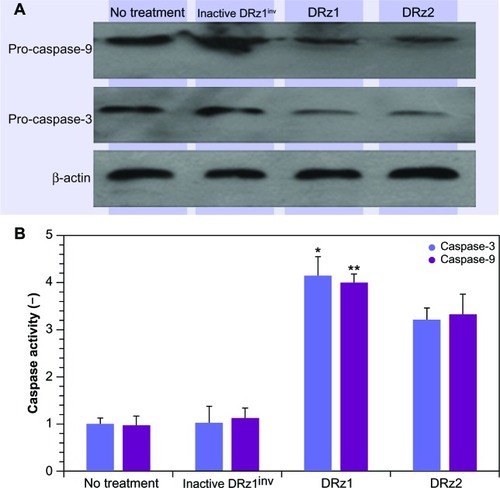
Figure 9 Evaluation of pro-caspase expression. (A) Western blot analysis. SMMC-7721 cells were transfected with 4 μg/mL (0.39 pmol/μL) DRz1 or DRz2. Procapsase-3 and -9 levels were assessed after 24 hours’ incubation via western blotting. A representative blot of three independent experiments is shown (n = 3). Densitometry analysis showed that the protein signal densities in DRz1-treated cells were lower than in control cells (no treatment). (B) Effect of IGF-IIP3 DRzs on caspase-3 or -9 activity in SMMC-7721 cells. The cells were kept in culture, treated with IGF-IIP3 DRzs for 24 hours, and subsequently analyzed for caspase-3 or -9 activity (n ≥3). *P < 0.05; **P < 0.01; ***P < 0.001.