Figures & data
Figure 1 Cloning, expression, and large-scale cultivation of dimeric thymosin beta 4 (DTβ4) engineered bacteria. (A) Two entire complementary DNA sequences of thymosin beta 4 (Tβ4) were constructed into a prokaryotic expression plasmid with a small DNA linker (GGTTCT). The results show a 267 bp fragment with correct sequence as expected (arrow). (B) Five colonies obtained after the transformation of Escherichia coli were randomly picked to test the protein expression on a small scale with sodium dodecyl sulfate polyacrylamide gel electrophoresis. After isopropyl β-D-1-thiogalactopyranoside (IPTG) induction, a new protein (arrow) appeared in each culture pellet and accounted for over 15% of all the bacteria proteins (1: molecular ladder; 2–6: protein expression of picked five clones; 7: protein expression without IPTG induction). (C) Bacterial growth curve of BL21/DTβ4 in a 10 L fermenter (the arrow indicates the induction time). (D) DTβ4 expression (arrow) during fermentation (1: DTβ4 expression without IPTG induction; 2–6: DTβ4 expression every hour after IPTG induction).
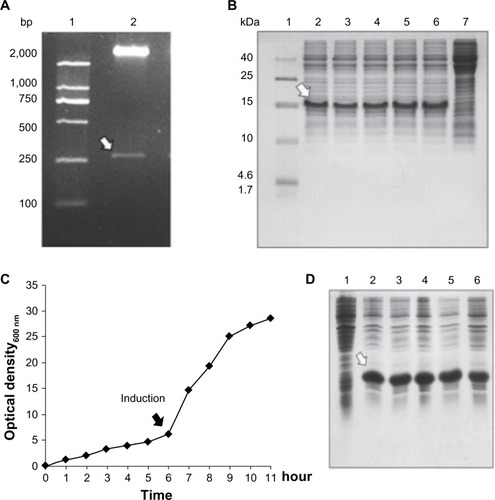
Table 1 The results of three batches of fermentation and purification of recombinant dimeric thymosin beta 4
Figure 2 Chromatogram of dimeric thymosin beta 4 (DTβ4) purification and high-performance liquid chromatography identification. (A) Chromatogram of hydrophobic interaction chromatography purification. DTβ4 was detected in the first elution fraction. (B) Sodium dodecyl sulfate polyacrylamide gel electrophoresis identification of each step during purification (1: molecular ladder; 2: DTβ4 expression after isopropyl β-D-1-thiogalactopyranoside induction; 3: without isopropyl β-D-1-thiogalactopyranoside; 4: the precipitation of 50% ammonium sulfate; 5: the supernatant of 50% ammonium sulfate [loading sample of hydrophobic interaction chromatography]; 6: unbounded elution; 7–9: elution fractions). The arrow indicates purified DTβ4 in the first elution. (C) High-performance liquid chromatography identification of the first elution.
![Figure 2 Chromatogram of dimeric thymosin beta 4 (DTβ4) purification and high-performance liquid chromatography identification. (A) Chromatogram of hydrophobic interaction chromatography purification. DTβ4 was detected in the first elution fraction. (B) Sodium dodecyl sulfate polyacrylamide gel electrophoresis identification of each step during purification (1: molecular ladder; 2: DTβ4 expression after isopropyl β-D-1-thiogalactopyranoside induction; 3: without isopropyl β-D-1-thiogalactopyranoside; 4: the precipitation of 50% ammonium sulfate; 5: the supernatant of 50% ammonium sulfate [loading sample of hydrophobic interaction chromatography]; 6: unbounded elution; 7–9: elution fractions). The arrow indicates purified DTβ4 in the first elution. (C) High-performance liquid chromatography identification of the first elution.](/cms/asset/742234a3-51cc-4d7a-8d9a-8dcfcd4ea2a9/dddt_a_50183_f0002_b.jpg)
Figure 3 The molecular weight and structure validations of dimeric thymosin beta 4 (DTβ4) with matrix-assisted laser desorption/ionization time-of-flight mass spectroscopy and Western blot. (A) The actual molecular weight of purified DTβ4 detected by mass spectroscopy was 9,961.0 Da, which was consistent with its theoretical molecular weight. (B) DTβ4 was recognized by thymosin beta 4 (Tβ4) monoclonal antibody (1–3: samples of three batches).
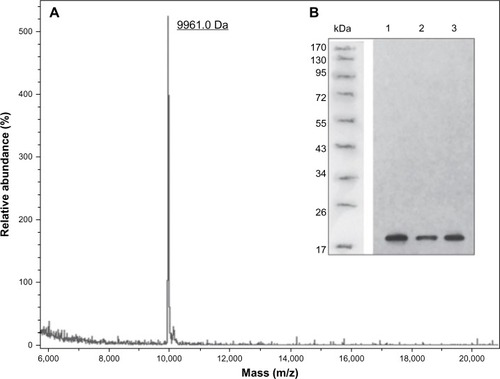
Figure 4 The proliferation of human umbilical vein endothelial cells under different concentrations of dimeric thymosin beta 4 (DTβ4), thymosin beta 4 (Tβ4), and phosphate-buffered saline (PBS). DTβ4 as well as Tβ4 promoted the proliferation of human umbilical vein endothelial cells in a dose-dependent manner in the 0–10 μg/ml concentration range. At each concentration, DTβ4 exhibited significant promotion compared with Tβ4. Compared with PBS, DTβ4 showed a promotion effect at 0.5 μg/mL, whereas Tβ4 showed a similar effect at 2 μg/mL.
P<0.01 versus PBS.
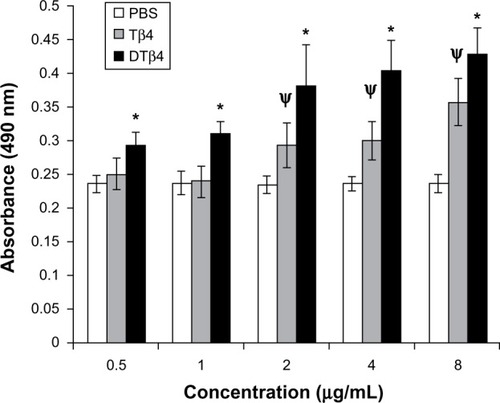
Figure 5 Dimeric thymosin beta 4 (DTβ4) exhibited more chemotactic effects on human umbilical vein endothelial cells than thymosin beta 4 (Tβ4) and phosphate-buffered saline (PBS) in the trans-well assay. At 1 μg/mL, an average of 38.5 ± 1.5 cells migrated onto the filter in response to DTβ4 compared with 21.3 ± 1.5 in response to Tβ4. At 10 μg/mL, 59.8 ± 2.5 cells migrated in response to DTβ4 compared with 29.6 ± 1.8 in response to Tβ4. The number of cells on the PBS treatment filter was 5.2 ± 1.1. (A) PBS; (B) Tβ4 (1 μg/mL); (C) Tβ4 (10 μg/mL); (D) DTβ4 (1 μg/mL); (E) DTβ4 (10 μg/mL).
P<0.01 versus PBS.
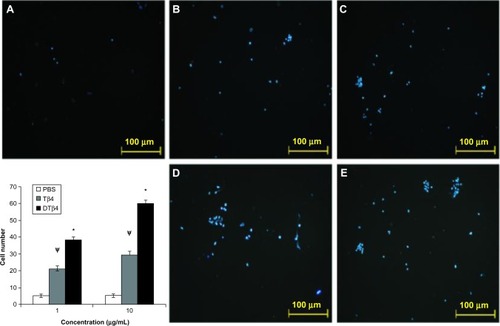
Figure 6 Dimeric thymosin beta 4 (DTβ4) exhibited more promotions than thymosin beta 4 (Tβ4) and phosphate-buffered saline (PBS) in the scratch assay. After 12 hours of treatment, the average distance that human umbilical vein endothelial cells moved from the edge of the scratch towards the center with 1 μg/mL DTβ4 treatment was 45.32 ± 8.8 μm compared with 22.45 ± 4.2 μm for Tβ4. After 10 μg/mL DTβ4 treatment, the human umbilical vein endothelial cells moved 80.2 ± 9.8 μm compared with 56.5 ± 4.8 μm for Tβ4. The human umbilical vein endothelial cells without any treatment moved 21.38 ± 3.2 μm, which was a significantly smaller distance than that of 1 μg/mL DTβ4 but not Tβ4. (A) PBS; (B) Tβ4 (1 μg/mL); (C) Tβ4 (10 μg/mL); (D) DTβ4 (1 μg/mL); (E) DTβ4 (10 μg/mL).
P<0.01 versus PBS.
Abbreviation: HUVEC, human umbilical vein endothelial cells.
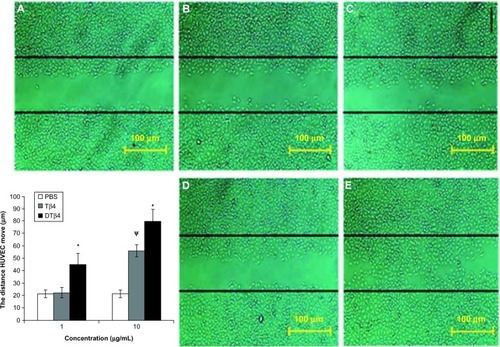
Figure 7 The stimulation of dimeric thymosin beta 4 (DTβ4) on the capillary-like structure formation of human umbilical vein endothelial cells was stronger than thymosin beta 4 (Tβ4) and phosphate-buffered saline (PBS). At 1 μg/mL, an average of 52.67 ± 3.2 capillary-like structures was observed in DTβ4 wells compared with 34.33 ± 2.3 for Tβ4. At 10 μg/mL, the average increased to 86.34 ± 6.7 and 68.67 ± 2.4, respectively. The average number of structures observed in PBS wells was 21.67 ± 1.2, which was significantly lower than that of DTβ4 and Tβ4 (P<0.01). (A) PBS; (B) Tβ4 (1 μg/mL); (C) Tβ4 (10 μg/mL); (D) DTβ4 (1 μg/mL); (E) DTβ4 (10 μg/mL).
P<0.01 versus PBS.
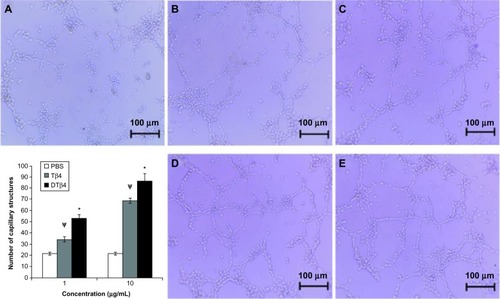
Table 2 Wound closure percentage during 10 days treatment with dimeric thymosin beta 4 or thymosin beta 4 hydrogel in normal rats
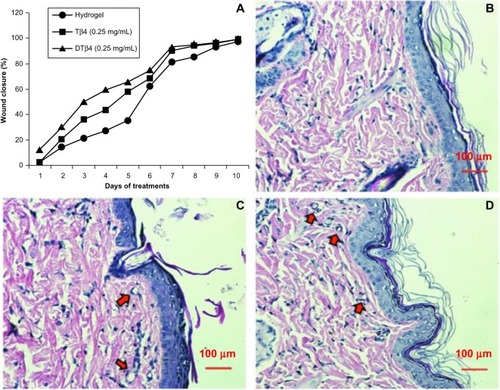
Figure 8 Wound repair evaluation proved either dimeric thymosin beta 4 (DTβ4) or thymosin beta 4 (Tβ4) increased the healing of punch wounds in rats at 0.25 mg/mL. (A) The rates of 50% healing in mid-dose DTβ4-treated (0.25 mg/mL) rats were approximately 3 days faster than the plain hydrogel or 1 day faster than Tβ4-treated rats. The healing of the plain hydrogel and Tβ4-treated rats eventually caught up with the mid-dose DTβ4 treatment at days nine and seven, respectively. Histological sections of (B) plain hydrogel, (C) DTβ4, and (D) Tβ4 show good re-epithelialization and angiogenesis in subcutaneous tissues. Compared with plain hydrogel, DTβ4 and Tβ4 resulted in more capillary growth (arrows).