Figures & data
Figure 1 Summary of the mRNA and protein analysis.
Notes: Summary of results analyzing the early treatment group (PND 21–42) (A); summary of results analyzing the late treatment group (treatment from PND 21–42, analysis at PND 101) (B). Statistical analysis was performed using a two-tailed Wilcoxon–Mann–Whitney test. Significance was accepted at P<0.05; n=7–8.
Abbreviations:
Grin, glutamate receptor ionotropic N-methyl-D-aspartate; HC, hippocampus; MES, mesencephalon; NET, norepinephrine transporter; NR, N-methyl-D-aspartate receptor subunit; PFC, prefrontal cortex; PND, postnatal day; Slc6a2, solute carrier family 6 member 2; Snap25, synaptosomal-associated protein 25 kDa; STR, striatum; Syp, synaptophysin; mRNA, messenger RNA.
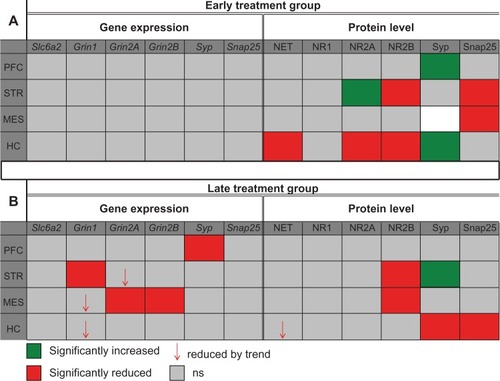
Figure 2 Atomoxetine induced changes on Slc6a2 messenger (m)RNA and NET levels.
Notes: Male adolescent rats were treated for 21 days (postnatal days 21–41) with atomoxetine hydrochloride (3 mg/kg, intraperitoneal [ip]) or saline (0.9%, ip). The striatum (STR), mesencephalon (MES), and hippocampus (HC) of the early treatment group were analyzed 24 hours after the last ip application, whereas the brains of rats assigned to the late treatment group were probed after a treatment-free period of 2 months. (A) Solute carrier family 6, member 2 (Slc6a2) expression was probed in the STR, MES HC. Bar diagrams depict mean values of quantitative reverse transcription polymerase chain reaction (qRT-PCR) measurement. (B) Bar diagrams depict mean values obtained by densitometric quantification of the (C) respective Western blots detecting the norepinephrine transporter (NET) at a molecular weight of ∼70 kDa. Controls were male age-matched saline-treated rats. All data are presented as ± standard error of the mean; early treatment group n=7; late treatment group n=8; ***P<0.001.
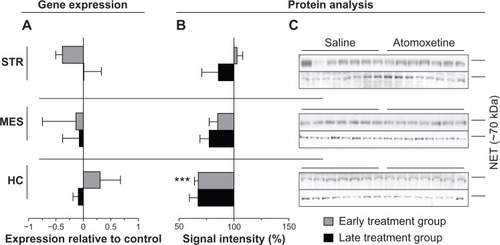
Figure 3 Atomoxetine induced changes on Grin1 messenger (m)RNA and NR1 levels.
Notes: Male adolescent rats were treated for 21 days (postnatal days 21–41) with atomoxetine hydrochloride (3 mg/kg, intraperitoneal [ip]) or saline (0.9%, ip). The striatum (STR), mesencephalon (MES), and hippocampus (HC) of the early treatment group were analyzed 24 hours after the last ip application, whereas the brains of rats assigned to the late treatment group were probed after a treatment-free period of 2 months. (A) Glutamate receptor ionotropic N-methyl-D-aspartate 1 (Grin1) expression was probed in the STR, MES, and HC. Bar diagrams depict mean values of quantitative reverse transcription polymerase chain reaction (qRT-PCR) measurement. (B) Bar diagrams depict mean values obtained by densitometric quantification of the (C) respective Western blots detecting the glutamate receptor ionotropic N-methyl-D-aspartate 1 (NR1) at a molecular weight of ∼120 kDa. Controls were male age-matched saline-treated rats. All data are presented as ± standard error of the mean; early treatment group n=6–7; late treatment group n=7–8; *P<0.05.
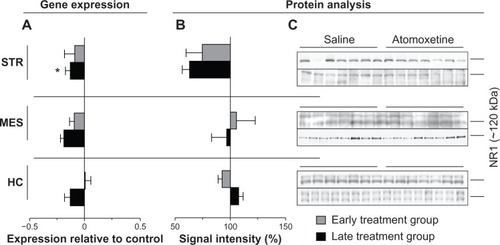
Figure 4 Atomoxetine induced changes on Grin2A messenger (m)RNA and NR2A levels.
Notes: Male adolescent rats were treated for 21 days (postnatal days 21–41) with atomoxetine hydrochloride (3 mg/kg, intraperitoneal [ip]) or saline (0.9%, ip). The striatum (STR), mesencephalon (MES), and hippocampus (HC) of the early treatment group were analyzed 24 hours after the last ip application, whereas the brains of rats assigned to the late treatment group were probed after a treatment-free period of 2 months. (A) Glutamate receptor ionotropic N-methyl-D-aspartate 2A (Grin2A) expression was probed in the STR, MES, and HC. Bar diagrams depict mean values of quantitative reverse transcription polymerase chain reaction (qRT-PCR) measurement. (B) Bar diagrams depict mean values obtained by densitometric quantification of the (C) respective Western blots detecting the glutamate receptor ionotropic N-methyl-D-aspartate 2A (NR2A) at a molecular weight of ∼170 kDa. Controls were male age-matched saline-treated rats. All data are presented as ± standard error of the mean, early treatment group n=7, late treatment group n=8; *P<0.05; **P<0.01.
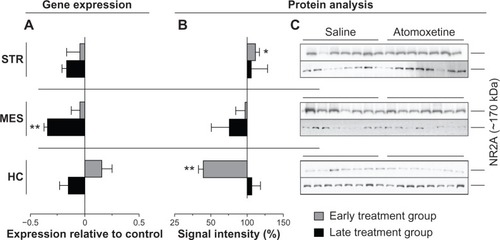
Figure 5 Atomoxetine induced changes on Grin2B messenger (m)RNA and NR2B levels.
Notes: Male adolescent rats were treated for 21 days (postnatal days 21–41) with atomoxetine hydrochloride (3 mg/kg, intraperitoneal [ip]) or saline (0.9%, ip). The striatum (STR), mesencephalon (MES), and hippocampus (HC) of the early treatment group were analyzed 24 hours after the last ip application, whereas the brains of rats assigned to the late treatment group were probed after a treatment-free period of 2 months. (A) Glutamate receptor ionotropic N-methyl-D-aspartate 2B (Grin2B) expression was probed in the STR, MES, and HC. Bar diagrams depict mean values of quantitative reverse transcription polymerase chain reaction (qRT-PCR) measurement. (B) Bar diagrams depict mean values obtained by densitometric quantification of the (C) respective Western blots detecting the glutamate receptor ionotropic N-methyl-D-aspartate 2B (NR2B) at a molecular weight of ∼170 kDa. Controls were male age-matched saline-treated rats. All data are presented as ± standard error of the mean; early treatment group n=7; late treatment group n=8; *P<0.05; **P<0.01.
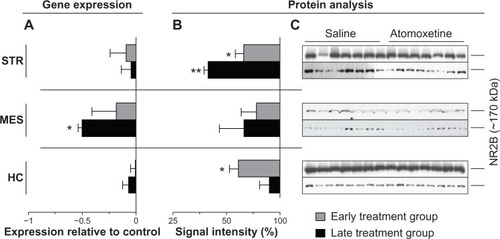
Figure 6 Atomoxetine induced changes on Syp messenger (m)RNA and protein levels.
Notes: Male adolescent rats were treated for 21 days (postnatal days 21–41) with atomoxetine hydrochloride (3 mg/kg, intraperitoneal [ip]) or saline (0.9%, ip). The prefrontal cortex (PFC), striatum (STR), and hippocampus (HC) of the early treatment group were analyzed 24 hours after the last ip application, whereas the brains of rats assigned to the late treatment group were probed after a treatment-free period of 2 months. (A) Synaptophysin (Syp) expression was probed in the PFC, STR, and HC. Bar diagrams depict mean values of quantitative reverse transcription polymerase chain reaction (qRT-PCR) measurement. (B) Bar diagrams depict mean values obtained by densitometric quantification of the (C) respective Western blots detecting Syp (1:1000) at a molecular weight of ∼34 kDa. Controls were male age-matched saline-treated rats. All data are presented as ± standard error of the mean; early treatment group n=7; late treatment group n=8; *P<0.05; **P<0.01; ***P<0.001.
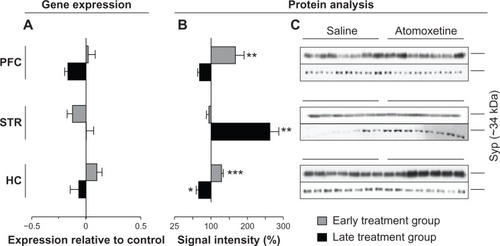
Figure 7 Atomoxetine induced changes on Snap25 messenger (m)RNA and protein levels.
Notes: Male adolescent rats were treated for 21 days (postnatal days 21–41) with atomoxetine hydrochloride (3 mg/kg, intraperitoneal [ip]) or saline (0.9%, ip). The striatum (STR) and hippocampus (HC) of the early treatment group were analyzed 24 hours after the last ip application, whereas the brains of rats assigned to the late treatment group were probed after a treatment-free period of 2 months. (A) Synaptosomal-associated protein 25 kDa (Snap25) expression was probed in the STR, MES, and HC. Bar diagrams depict mean values of quantitative reverse transcription polymerase chain reaction (qRT-PCR) measurement. (B) Bar diagrams depict mean values obtained by densitometric quantification of the (C) respective Western blots detecting the Snap25 (1:50,000) at a molecular weight of ∼25 kDa. Controls were male age-matched saline-treated rats. All data are presented as ± standard error of the mean; early treatment group n=7; late treatment group n=8; *P<0.05; **P<0.01.
Abbreviation: MES, mesencephalon.
Abbreviation: MES, mesencephalon.
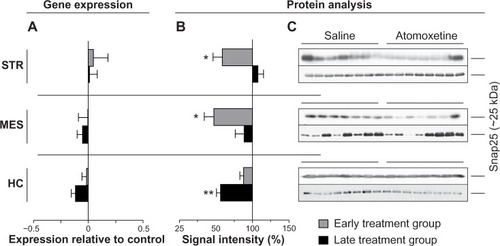
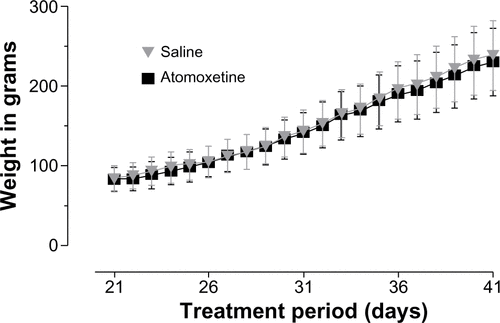
Figure S1 Weight gain of male adolescent rats during treatment period.
Notes: Sprague Dawley rats were treated once a day for 21 days (postnatal days 21–41) with atomoxetine hydrochloride (3 mg/kg intraperitoneal [ip]) or saline (0.9%, ip). The treatment period is equivalent to the period of adolescence in humans. Rats were weighed once per day before treatment. The graph depicts mean total weight of saline and atomoxetine treated rats, ± standard error of the mean; n=7.