Figures & data
Table 1 Characteristics of the study by treatment groups at the start of the study
Table 2 Intraocular pressure values during the study
Figure 1 Intraocular pressure (IOP) values during the study for the latanoprost group.
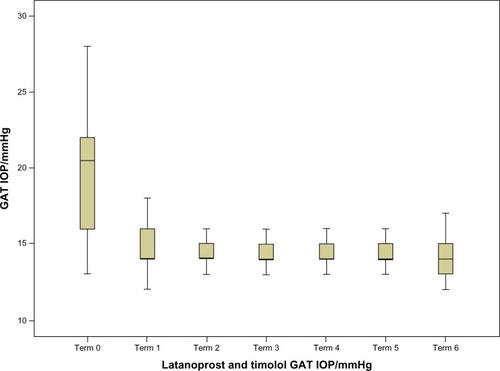
Figure 2 Intraocular pressure (IOP) values during the study for the latanoprost and timolol group.
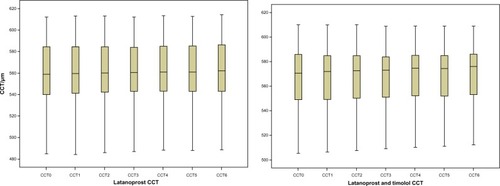
Table 3 Central corneal thickness evolution during the study, sorted by treatment
Figure 3 Central corneal thickness (CCT) evolution during the study, sorted by treatment.
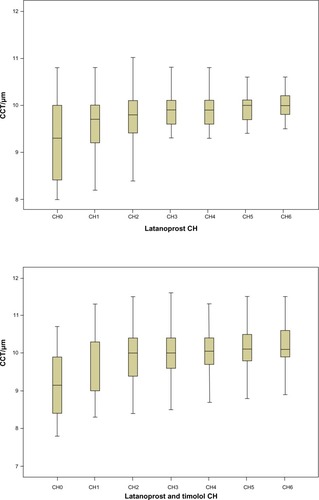
Table 4 Corneal hysteresis evolution during the study sorted by treatment
Figure 4 Corneal hysteresis (CH) evolution during the study, sorted by treatment.
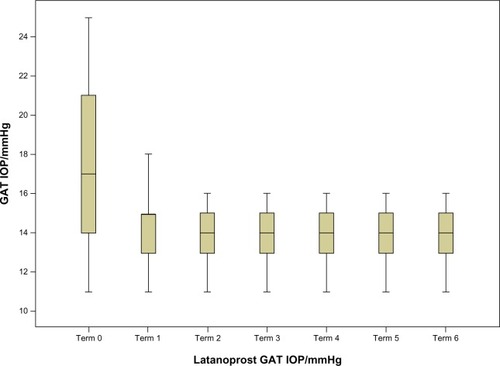
Table 5 Corneal resistance-factor evolution during the study sorted by treatment
Table 6 Correlations in changes in intraocular pressure with values of central corneal thickness (CCT) and corneal hysteresis (CH) for the two study groups