Figures & data
Figure 1 X-ray diffraction patterns of PASA-D (A), PASA-I (B) and free PASA (C).
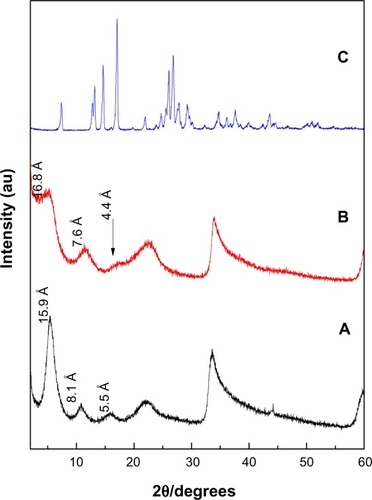
Figure 2 Three-dimensional structure of PASA (A) and molecular structural models of PASA intercalated between interlayers of Zn/Al-LDH (B).
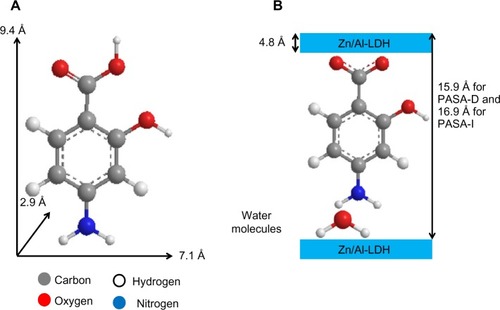
Figure 3 Fourier-transform infrared spectra of (A) PASA, (B) PASA-D, and (C) PASA-I.
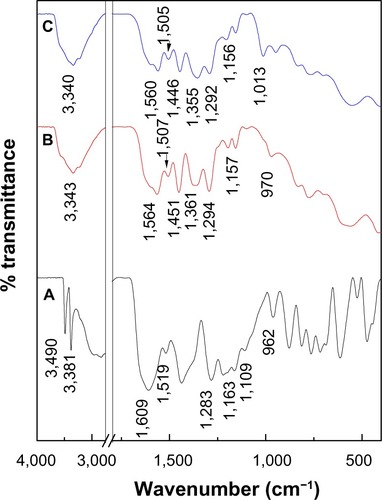
Table 1 Assignments of FTIR absorption bands of free PASA, PASA-D and PASA-I nanocomposites
Table 2 Chemical compositions of PASA, PASA-D, and PASA-I nanocomposites
Figure 4 Thermogravimetric analysis–differential thermogravimetric thermograms of PASA (A), PASA-D (B), and PASA-I (C).
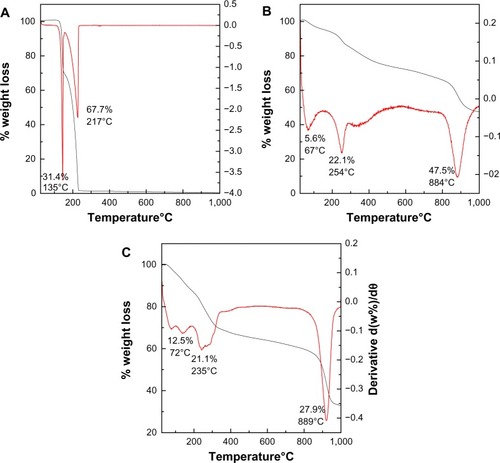
Figure 5 Field-emission scanning electron micrographs of PASA-D (A and B) and PASA-I (C and D) nanocomposites at 50,000× and 100,000× magnifications.
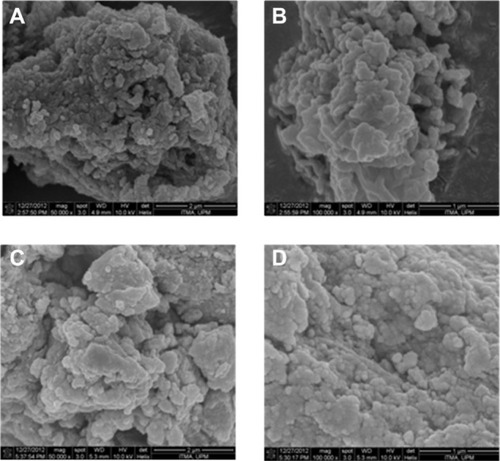
Figure 6 Release profiles of PASA from PASA-D (A) and PASA-I (B) nanocomposites into PBS at pH 7.4 and 4.8. Insets show the release profiles of PASA from nanocomposite at initial 500 minutes time.
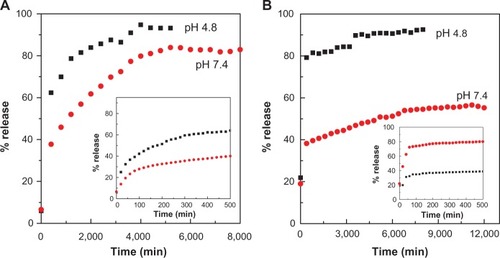
Table 3 Correlation coefficient (R 2), and rate constants (k) obtained by fitting the data of PASA release from PASA-D and PASA-I nanocomposites into PBS solution at pH 4.8 and 7.4
Figure 7 (A–D) Data fit of PASA release from PASA-D and PASA-I nanocomposites into pseudo-second-order kinetic model at pH 7.4 and 4.8.

Figure 8 Cell viability (3-[4,5-dimethylthiazol-2-yl]-2,5-diphenyltetrazolium bromide [MTT] assay) of 3T3 mouse fibroblast cells and human lung fibroblast MRC-5 cells exposed to various gradient concentrations at 24, 48, and 72 hours’ exposure time. The data presented are means ± standard deviation of triplicate samples.
![Figure 8 Cell viability (3-[4,5-dimethylthiazol-2-yl]-2,5-diphenyltetrazolium bromide [MTT] assay) of 3T3 mouse fibroblast cells and human lung fibroblast MRC-5 cells exposed to various gradient concentrations at 24, 48, and 72 hours’ exposure time. The data presented are means ± standard deviation of triplicate samples.](/cms/asset/8b926bc5-e5d6-414b-b9bb-6bd4b385f1c8/dddt_a_50665_f0008_c.jpg)