Figures & data
Figure 1 Cytotoxic effect of bozepinib and combined bozepinib/IFNα therapy. (A) Chemical structure of bozepinib. (B) MCF-7, HCT-116, and RKO cell lines treated with increasing amounts of bozepinib alone (circle) or in combination with 50 IU/mL IFNα (square) for 6 days as described in the Materials and methods section. Cell lines have been defined in material and methods section. The curve for cell survival is represented as a percentage compared to mock-treated cells. Values shown represent the mean of triplicate determinations calculated from a single experiment. Experiments were repeated at least three times.
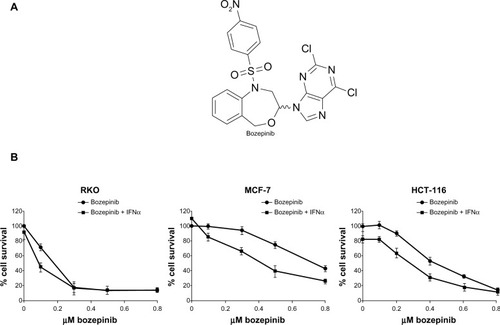
Table 1 Antiproliferative effects of bozepinib and bozepinip + IFNα on several cell lines
Figure 2 Apoptosis is enhanced by combination of bozepinib and IFNα. MCF-7, HCT-116, and RKO cell lines were mock-treated or treated with 5 µM bozepinib, 500 IU/mL IFNα, or the bozepinib/IFNα combination for 48 hours. Treated cells were then trypsinized and analyzed by flow cytometry using an Annexin V-fluorescein isothiocyanate detection kit. (A) Data are expressed as the mean ± standard error of the mean of three independent experiments. *P<0.05 (t-test). (B) Representative images from flow cytometry analysis.
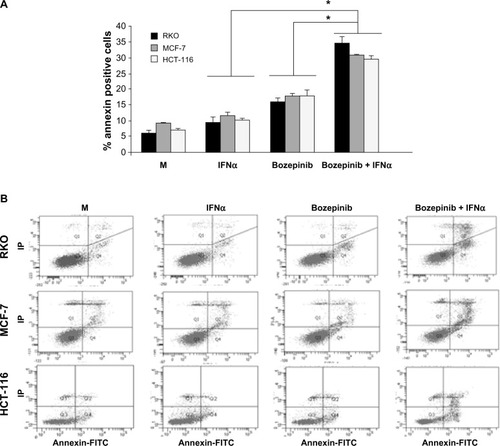
Figure 3 PKR and p53 activation during bozepinib treatment and its involvement in apoptosis and cell viability on bozepinib, IFNα, and the bozepinib/IFNα combination. (A) MCF-7 and HCT-116 cell lines were mock-treated or treated with 5 μM bozepinib for 4, 8, 16, and 24 hours. Total proteins were extracted for immunoblot analysis using anti-phospho PKR, anti-whole PKR, anti-phospho eIF2α, anti-whole eIF2α, anti-phospho p53, anti-whole p53, and anti-β-actin antibodies. (B) PKR+/+ and PKR−/− mouse embryonic fibroblasts were mock-treated or treated with 2.5 μM bozepinib, 500 IU/mL IFNα, or the bozepinib/IFNα combination over 48 hours. **P<0.01, by t-test (upper panel). Subsequently, the cells were trypsinized and analyzed by flow cytometry for Annexin V positive determination. Cells were treated with increasing amounts of bozepinib alone or in combination with 50 IU/mL of mouse IFNα over 6 days as described in the Materials and methods section. The curve for cell survival was represented as the percentage compared to mock-treated cells. Values shown represent the mean of triplicate determinations calculated from a single experiment. Experiments were repeated at least three times (lower panel). (C) A wild-type HCT-116 p53 cell line and an HCT-116 p53 knockout cell line expressing short hairpin RNAs targeting PKR or expressing a control short hairpin RNA were mock-treated or treated with 5 μM bozepinib, 500 IU/mL human IFNα, or a combination of bozepinib/IFNα for 48 hours. *P<0.05 (t-test).
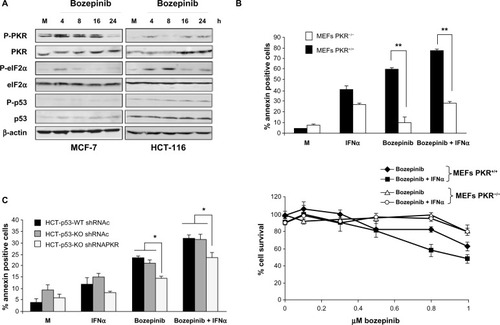
Figure 4 Bozepinib induced LC3-autophagosome formation that was strongly enhanced when combined with IFNα. (A) MCF-7 cells were mock-treated or treated with 5 µM bozepinib, 500 IU/mL human IFNα, or a combination of bozepinib/IFNα for 48 hours. Total proteins were extracted for immunoblot analysis using anti-LC3 and anti-β-actin antibodies. (B) MCF-7 cells were plated on cover slips supported in six-well plates and transfected with 5 μg of GFP-LC3 or GFP-control plasmids as described in the Materials and methods section. After 24 hours, the cells were treated with 5 µM bozepinib, 500 IU/mL human IFNα, or a combination of bozepinib/IFNα for 48 hours. Cells were fixed and visualized using a Radiance 2000 confocal microscope. (C) MCF-7 and HCT-116 cells were mock-treated or treated with 5 µM bozepinib, 500 IU/mL human IFNα, or a combination of bozepinib/IFNα for 48 hours. Cells were fixed and prepared for visualization by transmission electron microscopy as described in the Materials and methods section. Transmission electron microscopy images show that the treated cells included typical autophagolysosomes (arrows) containing organelles and lamellar structures. (D) MCF-7 cells were treated with 20 μM of chloroquine or 25 μM of Z-VAD inhibitors 2 hours before 5 μM bozepinib, 500 IU/mL IFNα, or a combination of bozepinib/IFNα. After 48 hours, the cells were treated with a Cell Counting Kit-8, measured at 450 nm optical density and represented as described in the Materials and methods section. Total proteins were extracted for immunoblot analysis using anti-LC3 and anti-β-actin antibodies. *P<0.05 (t-test). Western blot signals were quantified using Image J software, and relative β-actin-normalized values were assigned in reference to nontreated cells (value 1).
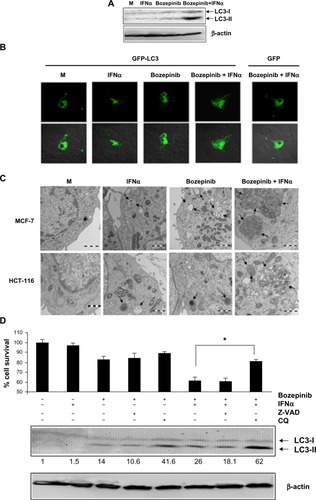
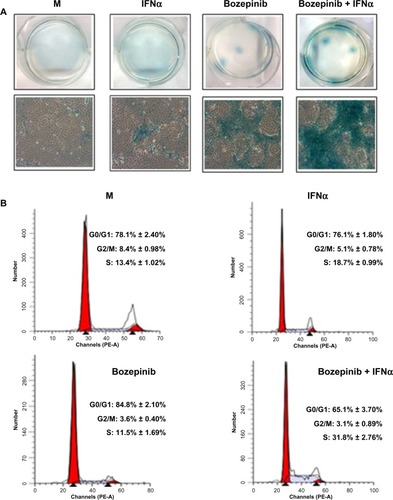
Figure 5 IFNα enhanced the ability of bozepinib to induce ß-galactosidase activity. MCF-7 cells were mock-treated or treated with 2.5 μM of bozepinib, 500 IU/mL human IFNα, or a combination of bozepinib/IFNα over 7 days. (A) Cells were fixed and stained using the Senescence β-Galactosidase Staining Kit as described in the Materials and methods section and photographed under a 10 × objective with a microscope (Leica) using visible light (lower panel) and the corresponding six wells were photographed under a 1 × objective using a standard camera (upper panel). (B) Cells were fixed and analyzed by flow cytometry after staining with propidium iodide. Values represent the mean of triplicate determinations calculated from a single experiment. Experiments were repeated at least three times.