Figures & data
Figure 1 Expression of P-glycoprotein and its mRNA in cerebral tissue. MDR1 was determined using real-time reverse transcription polymerase chain reaction and P-glycoprotein using Western blotting. RNA and total protein was extracted from the hippocampus (H) and cortex (C) of control rats and kindled rats. (A) Products of PCR were run on a 1% w/w agarose gel. β-actin (lower band, 241 bp) and MDR1 (upper band, 600 bp) are shown. (B) Semiquantitative analysis using gel after densitometry. The amount of MDR1 expression is represented by the ratio of MDR1 to β-actin (mean ± standard deviation, n=8) and normalized. *P<0.05 versus control group. (C) Western blotting of P-glycoprotein, and (D) quantitative analysis. The amount of P-glycoprotein expression was normalized to β-actin (mean ± standard deviation, n=8). *P<0.05 versus control group.
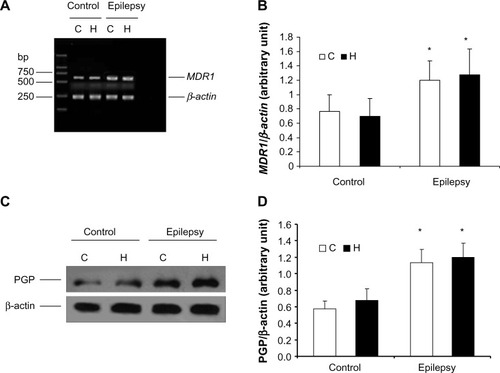
Figure 2 Concentrations of carbamazepine and phenytoin in extracellular cortical fluid and serum.
Abbreviations: CBZ, carbamazepine; PHT, phenytoin; AED, antiepileptic drug.
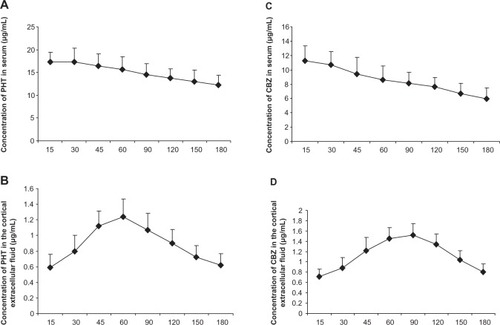
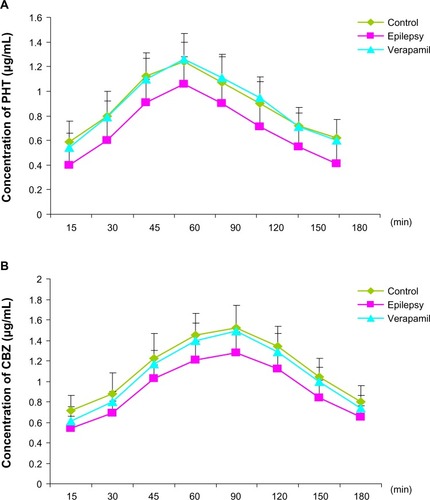
Figure 3 Concentrations of phenytoin (A) and carbamazepine (B) in extracellular cortical fluid as measured by high-performance liquid chromatography.
Abbreviations: CBZ, carbamazepine; PHT, phenytoin.