Figures & data
Table 1 Eligibility criteria, exclusion criteria, rejection criteria, and suspension criteria
Table 2 Patient and tumor characteristics
Table 3 Treatment-related toxicity
Figure 1 The LPFS, PFS, and OS of WBRT group versus WBRT+erlotinib group.
Notes: The median LPFS, PFS, and OS were 6.8 months (range, 0–18.7 months), 5.2 months (range, 0–14.7 months), and 8.9 months (range, 4.5–19.7 months), respectively, in the WBRT group and 10.6 months (range, 4.9–20.7 months), 6.8 months (range, 1.5–20.7 months), and 10.7 months (range, 5.3–29.7 months), respectively, in the combination group. There were statistically significant differences in the LPFS, PFS, and OS between the groups.
Abbreviations: CI, confidence interval; HR, hazard ratio; LPFS, local progression-free survival; OS, overall survival; PFS, progression-free survival; WBRT, whole brain radiotherapy.
Abbreviations: CI, confidence interval; HR, hazard ratio; LPFS, local progression-free survival; OS, overall survival; PFS, progression-free survival; WBRT, whole brain radiotherapy.
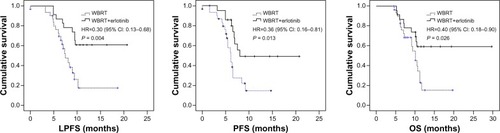
Figure 2 The LPFS, PFS, and OS of EGFR mutation patients versus EGFR wild-type patients in the combination arm.
Notes: In the combination group, 12 patients had no exons mutations; 11 patients had 19/21 exons mutations, and no patients had k-ras mutations. The median LPFS, PFS, and OS were 9.6 months (range, 6.9–16.4 months), 7.5 months (range, 6.2–16.1 months), and 10.2 months (range, 7.1–16.5 months), respectively, in the EGFR wild-type group and 11.2 months (range, 4.9–20.7 months), 6.1 months (range, 3.2–20.7 months), and 11.5 months (range, 5.3–29.7 months), respectively, in the EGFR mutation group. There were no statistically significant differences in the LPFS, PFS, and OS between the two groups.
Abbreviations: CI, confidence interval; HR, hazard ratio; LPFS, local progression-free survival; MT-EGFR, mutation-type EGFR patients; OS, overall survival; PFS, progression-free survival; WT-EGFR, wild-type EGFR patients; EGFR, epidermal growth factor receptor.
Abbreviations: CI, confidence interval; HR, hazard ratio; LPFS, local progression-free survival; MT-EGFR, mutation-type EGFR patients; OS, overall survival; PFS, progression-free survival; WT-EGFR, wild-type EGFR patients; EGFR, epidermal growth factor receptor.
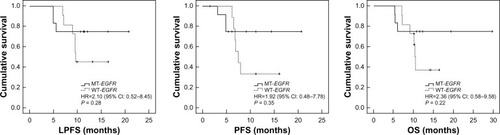
Table 4 Results of multivariate Cox regression analysis for LPFS, PFS, and OS