Figures & data
Figure 1 Study timeline with time points of clinical and laboratory assessments under Neoral (before switch) and Equoral (after switch).
Abbreviation: C0, trough level.
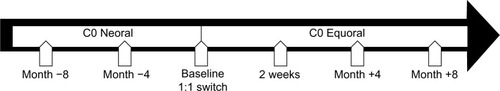
Table 1 Patient characteristics (n=20)
Table 2 Pre- and postconversion
Figure 2 Mean DNL and 95% confidence interval in all patients under Neoral and Equoral.
Note: Switch: time point of conversion from Neoral to Equoral.
Abbreviation: DNL, dose-normalized predose level.
Abbreviation: DNL, dose-normalized predose level.
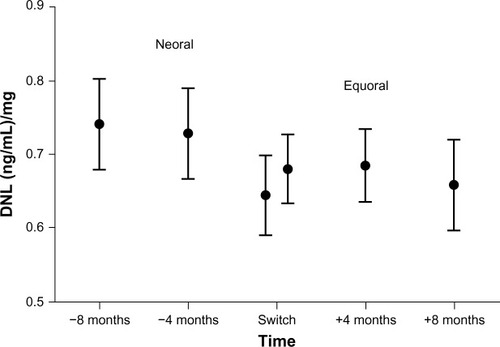
Table 3 Differences in DNL on Neoral before switch
Table 4 Differences in C0 (ng/mL) Level on Neoral before switch
Table 5 Differences in DNL on Equoral after switch
Table 6 Differences in C0 (ng/mL) level on Equoral after the switch
Figure 3 Corresponding values of mean cyclosporine dose and 95% confidence interval in all patients under Neoral and Equoral.
Note: Switch: time point of conversion from Neoral to Equoral.
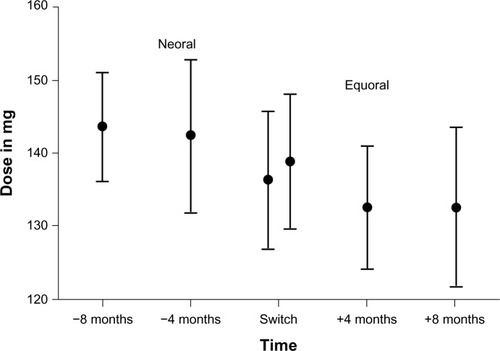
Table 7 Routine laboratory