Figures & data
Table 1 Current status and rationale of biomarkers included in the current study
Table 2 Study demographics
Table 3 Summary statistics of plasma and urine samples analyzed with routine kidney biomarkers in the current study
Table 4 Summary statistics of urine samples analyzed with renal biomarkers under characterization within the current study
Table 5 Effect of sex (20 males and 19 females) on the renal biomarkers under characterization within this study
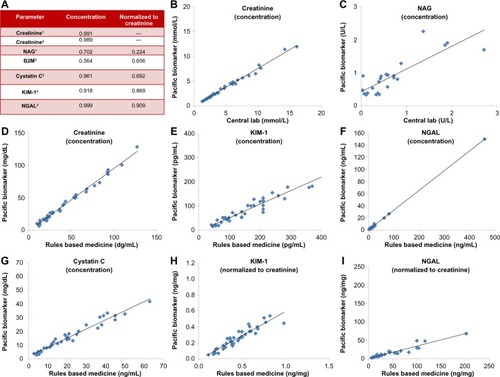
Figure 1 Plots of vendor assay correlations. (A) Coefficient of determination (r 2) for each biomarker with assays from two vendors. (B–I) are biomarkers with r 2≥0.700 (B) Creatinine concentration, (C) NAG concentration, (D) creatinine concentration, (E) KIM-1 concentration, (F) NGAL concentration, (G) cystatin C concentration, (H) KIM-1 concentration normalized to creatinine, and (I) NGAL concentration normalized to creatinine.
Abbreviations: KIM-1, kidney injury marker-1; NAG, N-acetyl-β-glucosaminidase; NGAL, neutrophil gelatinase-associated lipocalin.