Figures & data
Figure 1 Chronology of clinical trials 1 and 2, indicating assessment of pain thresholds (*), elapsed times, drug administration, and blood samplings (♦), and blood samplings only for clinical trial 2.
Abbreviations: T, time; h, hour.
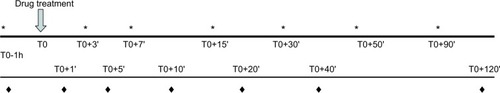
Table 1 Clinical trial 1: descriptive statistics on pharmacokinetic parameters
Table 2 Clinical trials 1 (CT1) and 2 (CT2): descriptive statistics on pharmacodynamic-derived parameters (pain thresholds)
Figure 2 Pharmacokinetic profile of 1 g intravenous (iv) and 250 mg buccal acetaminophen.
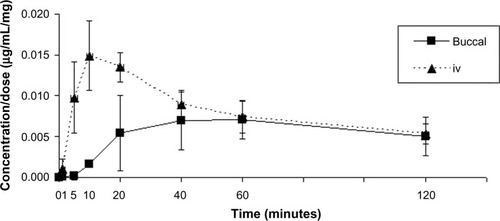
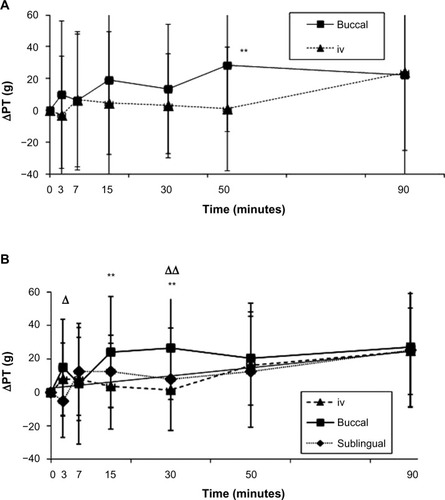
Figure 3 Antinociceptive profiles obtained during (A) clinical trial 1 for 1 g intravenous (iv) and 250 mg buccal (b) acetaminophen (APAP) and (B) during clinical trial 2 for 1 g iv APAP, 125 mg bAPAP, and 125 mg sublingual (s)APAP.
Notes: **P<0.01 (bAPAP versus ivAPAP); Δ P<0.05; ΔΔ P<0.01 (bAPAP versus sAPAP).
Abbreviation: PT, pain threshold.
Abbreviation: PT, pain threshold.