Figures & data
Figure 1 Chemical structures of compounds examined for their inhibitory effect on hepatic IS production.
Abbreviation: IS, indoxyl sulfate.
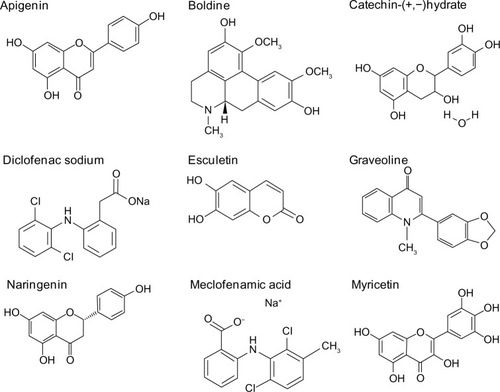
Figure 2 In vitro inhibitory effect of several compounds on IS production using the rat liver S9 fraction.
Notes: The reaction mixture (total volume 250 μL), containing 50 mM sodium phosphate buffer (pH 7.4), rat liver S9 fraction (5–10 mg protein/mL), indole (100 μM), NADPH (1 mM), adenosine 3′-phosphate 5′-phosphosulfate (20 μM), and uridine diphosphate glucuronic acid (1 mM), was incubated with or without test compound (10 μM) at 37°C for 30 minutes. Each column represents the mean ± standard deviation for three independent measurements.
Abbreviations: NADPH, nicotinamide adenine dinucleotide phosphate; IS, indoxyl sulfate.
Abbreviations: NADPH, nicotinamide adenine dinucleotide phosphate; IS, indoxyl sulfate.
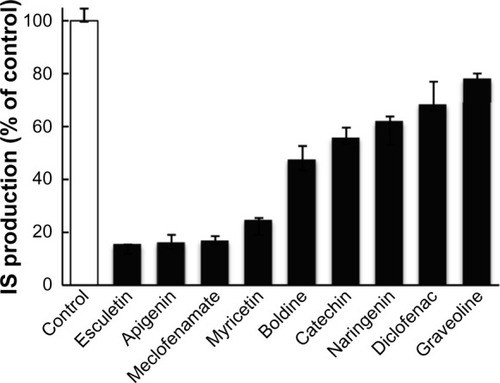
Figure 3 Dose-dependent inhibition of IS production by several compounds using rat liver S9 fraction.
Notes: The reaction mixture containing 50 mM sodium phosphate buffer (pH 7.4), rat liver S9 fraction, indole (100 μM), NADPH (1 mM), adenosine 3′-phosphate 5′-phosphosulfate (20 μM), and uridine diphosphate glucuronic acid (1 mM) was incubated at 37°C for 30 minutes with or without test compounds at various concentrations. Each point represents the mean of three independent measurements. The apparent IC50 values are indicated for each graph for compound tested.
Abbreviations: IS, indoxyl sulfate; NADPH, nicotinamide adenine dinucleotide phosphate.
Abbreviations: IS, indoxyl sulfate; NADPH, nicotinamide adenine dinucleotide phosphate.
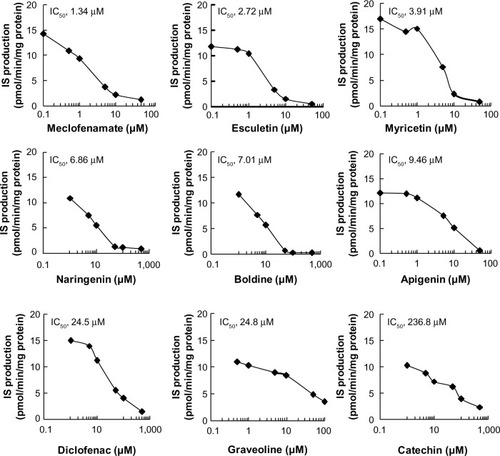
Figure 4 Effect of meclofenamate on IS concentration in rats treated with renal I/R.
Notes: (A) Serum IS concentration in control rats (open circle) and renal I/R-treated rats with (closed rhombus) or without (closed circle) intravenous administration of meclofenamate (10 mg/kg) 6, 12, and 18 hours after renal I/R treatment. Each point represents the mean ± standard deviation for three to four rats in each group. Renal (B) and hepatic (C) IS concentration in control rats (sham) and renal I/R-treated rats with (I/R + Mecl) or without (I/R) intravenous administration of meclofenamate. **P<0.01 versus sham (control); ##P<0.01 versus I/R.
Abbreviations: IS, indoxyl sulfate; I/R, ischemia/reperfusion; Mecl, meclofenamate.
Abbreviations: IS, indoxyl sulfate; I/R, ischemia/reperfusion; Mecl, meclofenamate.
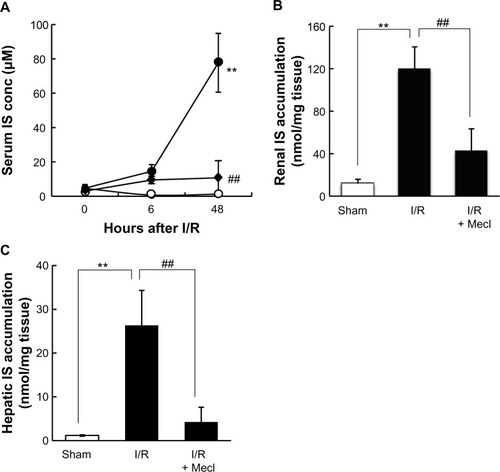
Figure 5 Effect of meclofenamate on renal function of rats treated with renal I/R.
Notes: Serum BUN (A) and creatinine (B) levels in control rats (sham), renal I/R-treated rats with (I/R + Mecl) or without (I/R) intravenous administration of meclofenamate. **P<0.01 versus sham (control); ##P<0.01 versus I/R.
Abbreviations: I/R, ischemia/reperfusion; BUN, blood urea nitrogen; Mecl, meclofenamate; Cr, creatinine.
Abbreviations: I/R, ischemia/reperfusion; BUN, blood urea nitrogen; Mecl, meclofenamate; Cr, creatinine.
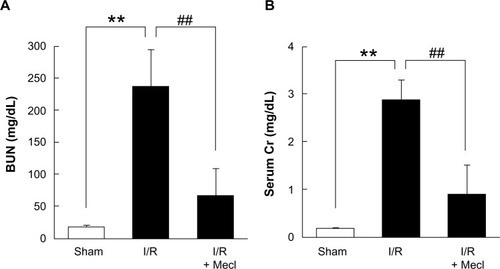
Figure 6 Expression of rOAT1 and rOAT3 in the kidney of rats treated with I/R. Meclofenamate (10 mg/kg) was intravenously administered to rats 6, 12, and 18 hours after renal I/R.
Notes: Renal tissue samples were collected 48 hours after I/R treatment, and used for immunoblotting of rOAT1 and rOAT3. Panels (A and B) show the representative blots for rOAT1 and rOAT3, respectively. The band density of rOAT1 and rOAT3 was determined densitometrically and the relative density ratio to control (sham) is represented as columns with the mean ± standard deviation for three to four rats in each group. *P<0.05 versus control (sham); #P<0.05 versus I/R.
Abbreviations: rOAT, rat organic anion transporter; I/R, ischemia/reperfusion; Mecl, meclofenamate.
Abbreviations: rOAT, rat organic anion transporter; I/R, ischemia/reperfusion; Mecl, meclofenamate.
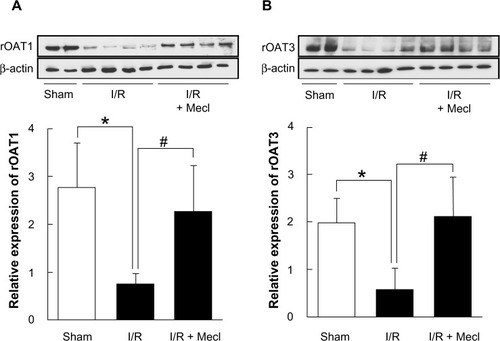
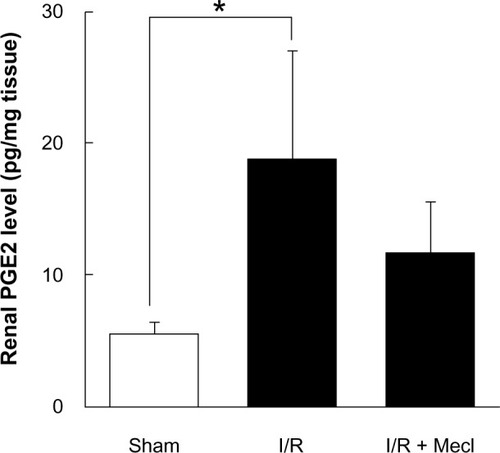
Figure 7 Renal PGE2 levels in the kidney of rats.
Notes: Effect of meclofenamate on PGE2 level was examined in the kidney of control rats (sham) and renal I/R-treated rats with (I/R + Mecl) or without (I/R) intravenous administration of meclofenamate (10 mg/kg). Each column represents the mean ± standard deviation for three to four rats in each group. *P<0.05 versus control (sham).
Abbreviations: PGE2, prostaglandin E2; I/R, ischemia/reperfusion; Mecl, meclofenamate.
Abbreviations: PGE2, prostaglandin E2; I/R, ischemia/reperfusion; Mecl, meclofenamate.