Figures & data
Table 1 The experimental design and specifications
Figure 1 A chromatogram analysis of EEAM, characterized with the GC-MS-TOF.
Abbreviations: EEAM, ethyl acetate extract of Annona muricata leaves; GC-MS-TOF, gas chromatography–time-of-flight mass spectrometry; AIC, analytical ion chromatogram.
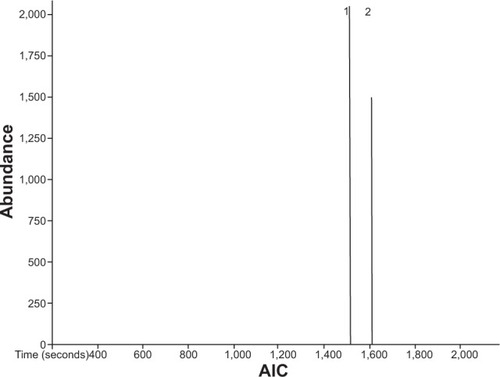
Table 2 Effects of EEAM on renal and liver function tests of rats after 14 days of acute toxicity study did not show any significant differences between vehicle control and EEAM treated groups
Figure 2 Histopathology analysis (H&E staining, 20×) of kidney and liver from control, EEAM at 1 g/kg, and EEAM at 2 g/kg demonstrated no significant differences in the structures of kidney and liver between vehicle control and EEAM-treated groups.
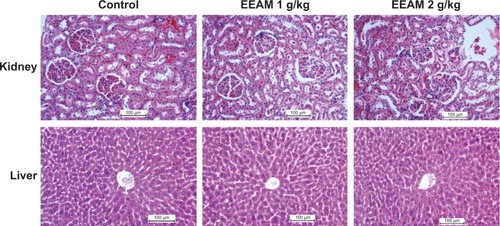
Figure 3 Gross appearances of stomach from five groups of rats, namely: (A) normal control, (B) lesion control, (C) low dose of EEAM, (D) high dose of EEAM, and (E) omeprazole control. Quantitative analysis of ulcer index showed significant reduction in the ulcer index after pretreatment with EEAM (200 mg/kg and 400 mg/kg), and omeprazole.
Abbreviations: EEAM, ethyl acetate extract of Annona muricata leaves; SEM, standard error of the mean.
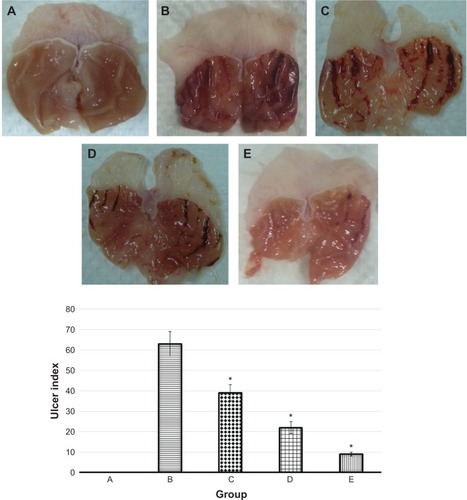
Figure 4 Measurement of (A) GWM (μg of alcian blue per gram of tissue) and (B) pH in five groups of rats, namely: (A) normal control, (B) lesion control, (C) low dose of EEAM, (D) high dose of EEAM, and (E) omeprazole control.
Abbreviations: GWM, gastric wall mucus; EEAM, ethyl acetate extract of Annona muricata leaves; SEM, standard error of the mean.
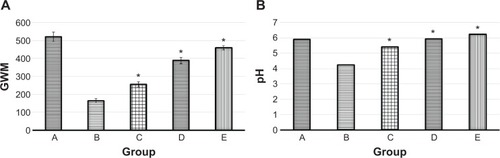
Table 3 Effect of EEAM at (C) 200 mg/kg and (D) 400 mg/kg doses, and (E) omeprazole on enzymatic activities of stomach tissue homogenate. (A) and (B) are presenting the normal control and lesion control groups, respectively
Figure 5 Histopathological staining of gastric tissues after treatment with EEAM at (C) 200 mg/kg and (D) 400 mg/kg doses, and (E) omeprazole, using H&E staining (20×). (A) and (B) are presenting the normal control and lesion control groups, respectively. In the lesion control group, there are clear signs of severe damage to the surface epithelium (white arrow) and leukocyte infiltration (yellow arrow).
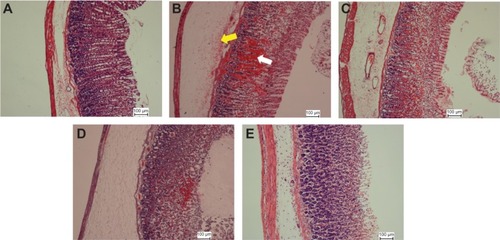
Figure 6 Histopathological staining of gastric tissues after treatment with EEAM at (C) 200 mg/kg and (D) 400 mg/kg doses, and (E) omeprazole, using PAS staining (20×). (A) and (B) are presenting the normal control and lesion control groups, respectively. PAS staining illustrated the glycogen accumulation (red arrow) in rats pretreated with EEAM and omeprazole.
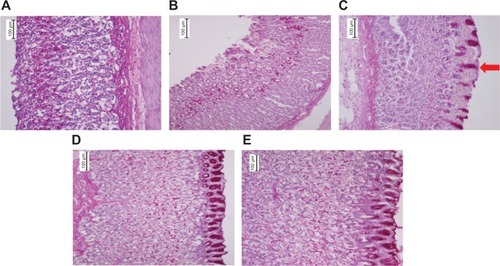
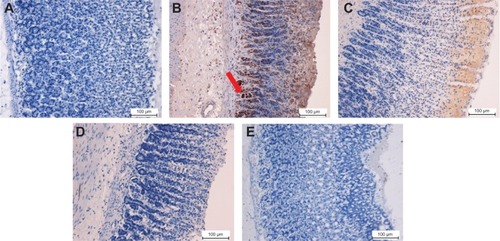
Figure 7 Immunohistochemical analysis of Hsp70 expression from five groups of rats, namely: (A) normal control, (B) lesion control, (C) low dose of EEAM, (D) high dose of EEAM, and (E) omeprazole control. Immunohistochemistry staining showed upregulation of Hsp70 in groups C–E. (A) and (B) are presenting the normal control and lesion control groups, respectively. The yellow arrow shows Hsp70 accumulation in gastric tissue (20×).
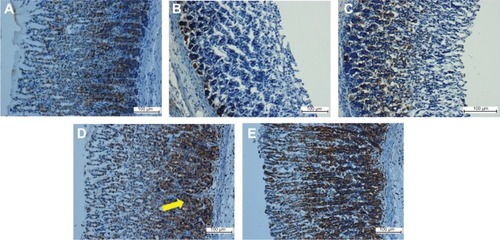
Figure 8 Immunohistochemical analysis of Bax protein expression from five groups of rats, namely: (A) normal control, (B) lesion control, (C) low dose of EEAM, (D) high dose of EEAM, and (E) omeprazole control. Immunohistochemistry staining showed downregulation of Bax in groups C–E. (A) and (B) are presenting the normal control and lesion control groups, respectively. The red arrow shows Bax protein accumulation in gastric tissue (20×).