Figures & data
Figure 1 Ultrasound nebulizers (upper row) and jet nebulizers (lower row).
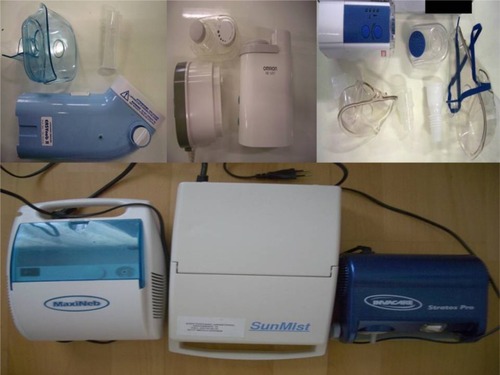
Figure 2 Large residual cups.
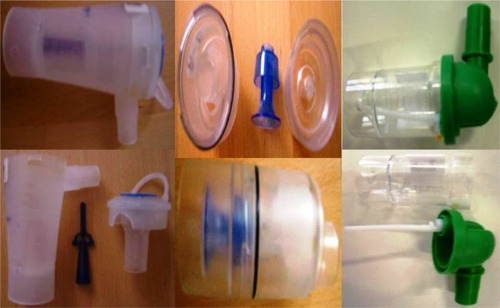
Figure 3 Small residual cups.
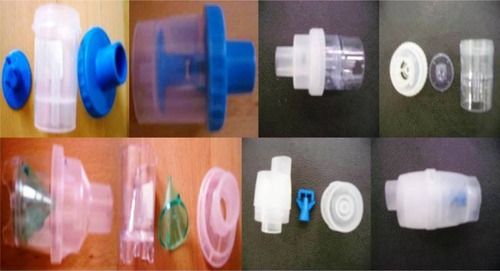
Figure 4 Mastersizer 2000.
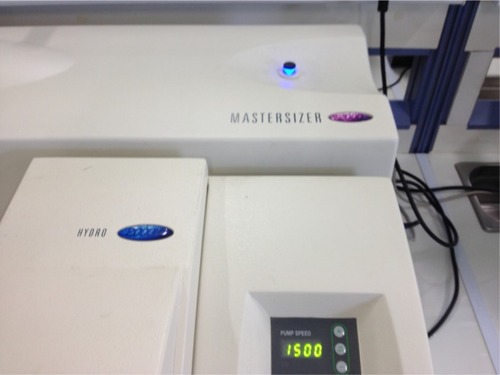
Figure 5 Porcelain milling ball.
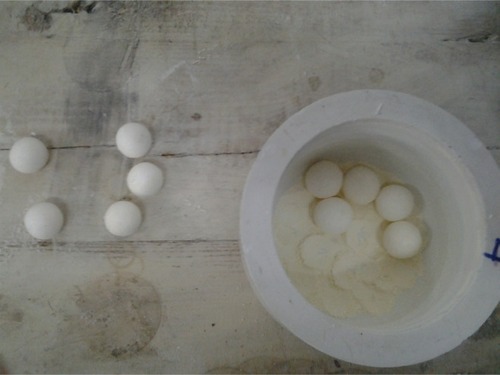
Table 1 Analysis of variance for effects of four fixed factors and their interactions on mass median aerodynamic diameter
Figure 6 Mean mass median aerodynamic diameter (MMAD) values using various cup designs. Vertical lines denote the 95% confidence intervals extracted from the mean square error (analysis of variance).
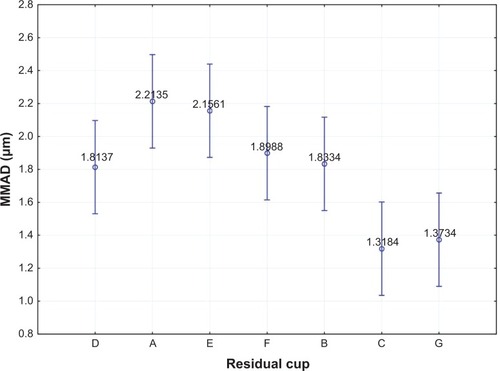
Figure 7 Mean mass median aerodynamic diameter (MMAD) values according to residual cups and drug inhalation. Vertical lines denote the 95% confidence intervals extracted from the mean square error (analysis of variance).
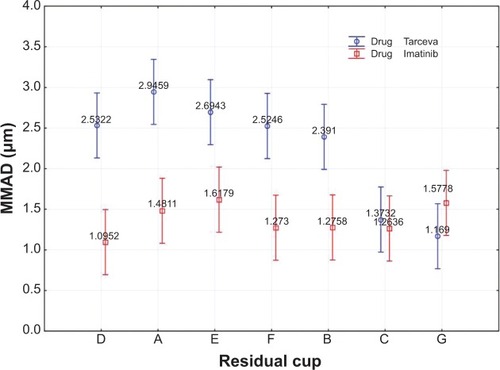
Figure 8 Mean mass median aerodynamic diameter (MMAD) changes with increasing loading levels. Vertical lines denote the 95% confidence intervals extracted from the mean square error (analysis of variance).
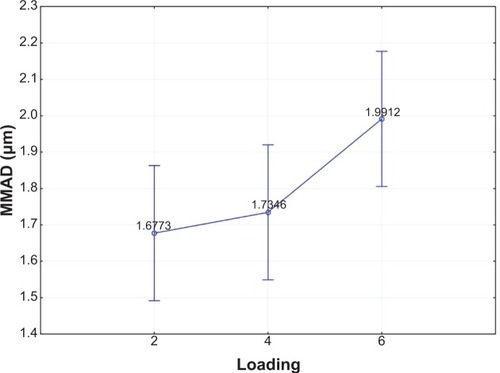
Figure 9 Mean mass median aerodynamic diameter (MMAD) values according to the combined performance of drugs and nebulizers. Vertical lines denote the 95% confidence intervals extracted from the mean square error (analysis of variance).
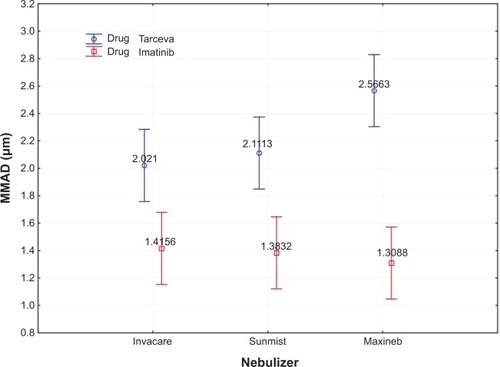
Table 2 Analysis of variance of effect of four fixed factors and their interactions on mass median aerodynamic diameter
Table 3 Mean values of mass median aerodynamic diameter and 95% confidence intervals for drugs, mouthpiece devices, loading levels, and nebulizers calculated from the mean square error (analysis of variance)
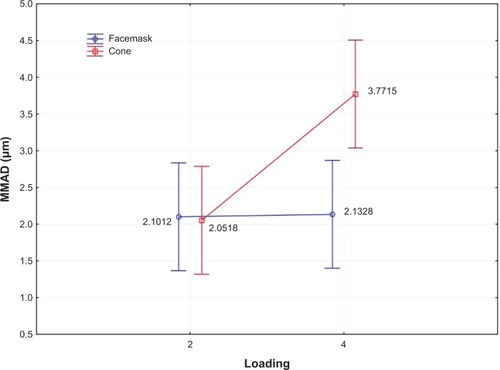
Figure 10 Mean mass median aerodynamic diameter (MMAD) values according to loading levels and mouthpiece devices. Vertical lines denote the 95% confidence intervals extracted from the mean square error (analysis of variance).