
Figures & data
Table 1 Baseline characteristics of 30 included trials in the meta-analysis (n=8,891)
Figure 1 Flow chart demonstrating the process of study selection.
Abbreviation: OHA, oral hypoglycemic agent.
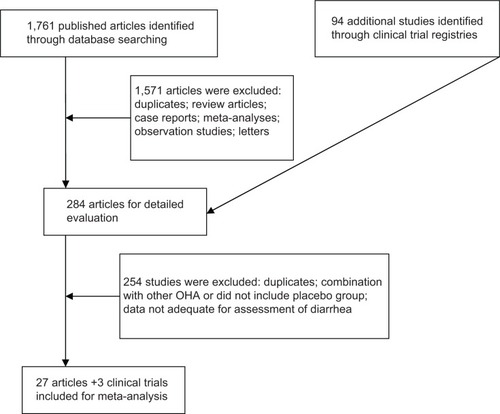
Figure 2 Incidence of diarrhea associated with sitagliptin.
Note: aProportion represents diarrhea as a proportion of the different types of reactions to sitagliptin.
Abbreviations: CI, confidence interval; W, weight.
Abbreviations: CI, confidence interval; W, weight.
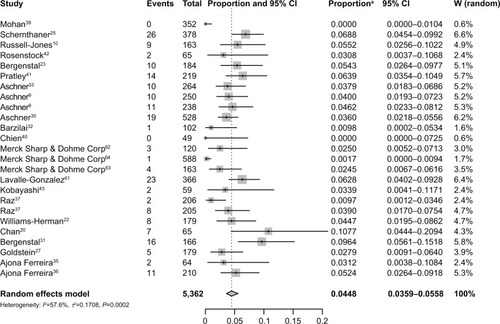
Figure 3 Incidence and risk of diarrhea with sitagliptin use based on subgroups.
Note: aProportion represents diarrhea as a proportion of the different types of reactions to sitagliptin.
Abbreviations: CI, confidence interval; W, weight.
Abbreviations: CI, confidence interval; W, weight.
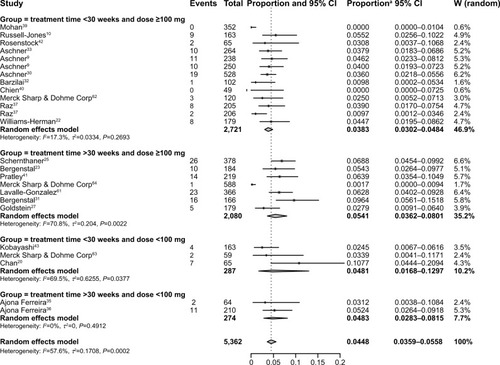
Figure 4 Odds ratios of diarrhea associated with sitagliptin versus controls.
Abbreviations: OR, odds ratio; CI, confidence interval; W, weight.
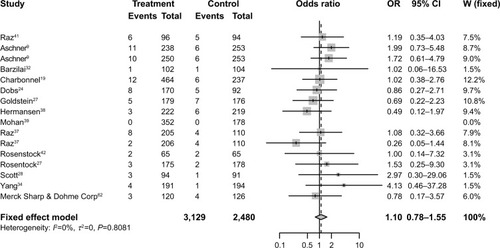
Figure 5 Funnel plot of standard error by odds ratio for diarrhea.
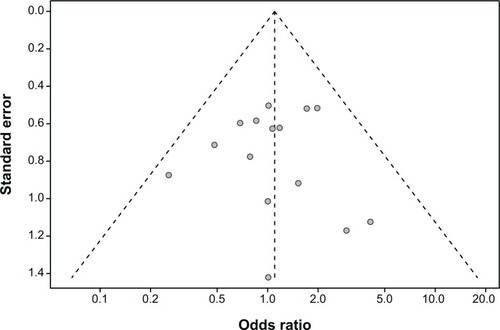
Figure S1 Embase search strategy.
Abbreviation: exp, extensive search.
Figure S2 PubMed search strategy.
Figure S3 Cochrane Library search strategy.
Abbreviations: ab, abstract; kw, keyword; ti, title.
Table S1 PRISMA 2009 checklist