Figures & data
Figure 1 Effects of T2A on the redox function and expression of APE1.
Abbreviations: T2A, tanshinone IIA; AP-1, activator protein-1; APE, apurinic/apyrimidinic endonuclease; APE1wt, wild-type APE1; APE1shRNA, short hairpin RNA knockdown APE1; APE1C65S, redox-deficient mutant APE1; NF-κB, nuclear factor-κB; NS, not significant; HIF-1α, hypoxia-inducible transcription factor 1α; EMSA, electrophoretic mobility-shift assay; SP-1, specificity protein-1.
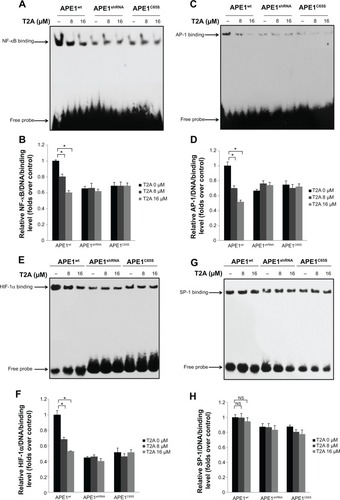
Figure 2 Effects of T2A on AP site incision and interaction activity of APE1.
Abbreviations: NS, not significant; AP, apurinic/apyrimidinic; APE, apurinic/apyrimidinic endonuclease; oligo, oligonucleotide; DMSO, dimethyl sulfoxide; T2A, tanshinone IIA; CRT, CRT0044876.
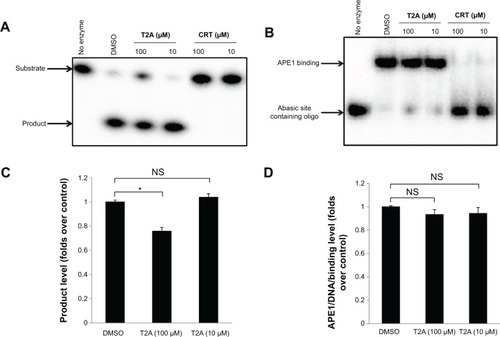
Figure 3 Binding affinity and docking simulation of T2A–APE1 interaction.
Abbreviations: T2A, tanshinone IIA; APE, apurinic/apyrimidinic endonuclease; Asp, asparagine; DPI, dual polarization interferometry; Gln, glutamine; Leu, leucine; Ser, serine; 3D, three-dimensional; 2D, two-dimensional.
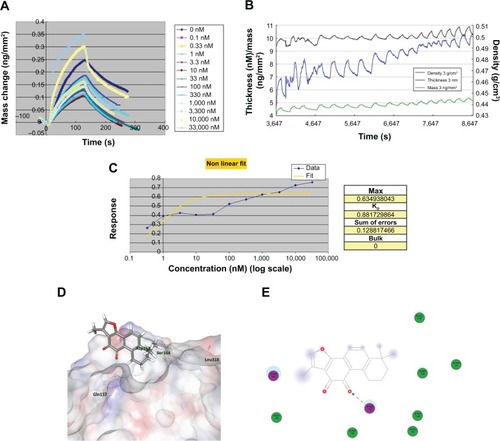
Figure 4 Dose- and time-dependent effects of T2A on the growth of HeLa, HCT116, and HUVEC cells.
Abbreviations: T2A, tanshinone IIA; HeLa, human cervical cancer cell line; HCT116, human colon cancer cell line; HUVEC, human umbilical veins endothelial cells; MTT, 3-(4, 5-dimethylthiazol-2-yl)-2, 5-diphenyltetrazolium bromide.
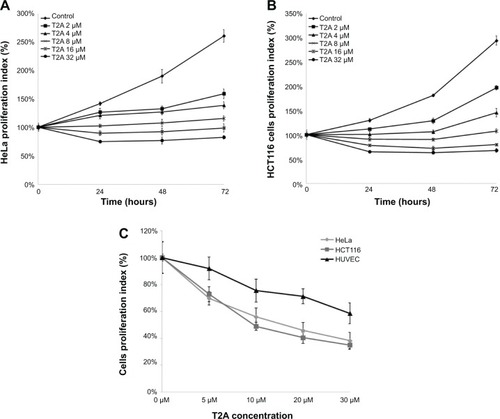
Figure 5 Effect of APE1 knockdown or its redox mutation on the T2A activities in cell growth.
Abbreviations: APE, apurinic/apyrimidinic endonuclease; T2A, tanshinone IIA; MTT, 3-(4, 5-dimethylthiazol-2-yl)-2, 5-diphenyltetrazolium bromide; PARP, poly adenosine diphosphate ribose polymerase; NS, not significant; APE1wt, wild-type APE1; APE1shRNA, short hairpin RNA knockdown APE1; APE1C65S, redox-deficient mutant APE1.
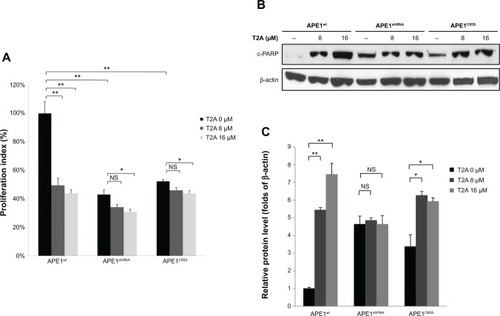
Figure 6 Effects of T2A on genotoxic potential of chemical agents and ionizing radiation in HeLa and HCT116 cells.
Abbreviations: T2A, tanshinone IIA; NS, not significant; SR, survival rate; Eto, etoposide; MMC, mitomycin C; MTT, 3-(4, 5-dimethylthiazol-2-yl)-2, 5-diphenyltetrazolium bromide; MMS, methyl methanesulfonate; Cpt, camptothecin; HU, hydroxyurea; IR, ionizing radiation; HeLa, human cervical cancer cell line; HCT116, human colon cancer cell line.
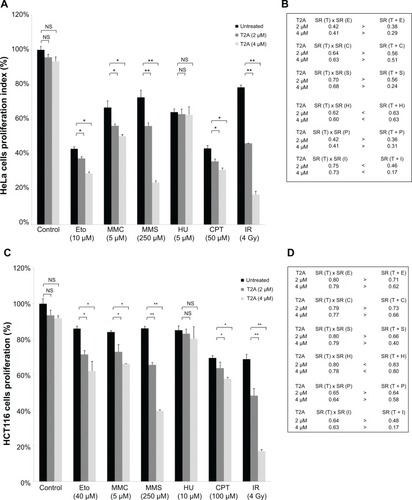
Figure S1 Representative Western blot images showing APE1 endogenous and exogenous protein levels in control (HeLa cells), APE1shRNA, APE1wt, and APE1C65S cells.
Figure S2 Increasing amounts of E3330 or T2A were incubated for 30 minutes with the nuclear extracts of HeLa cells.
Abbreviations: T2A, tanshinone IIA; NF-κB, nuclear factor-κB; EMSA, electrophoretic mobility-shift assay; HeLa, human cervical cancer cell line.
Figure S3 View of T2A docked into the X-ray crystallographic structure of APE1.
Figure S4 HeLa cells were treated with T2A at indicated dose for 24 hours.
Abbreviations: T2A, tanshinone IIA; APE, apurinic/apyrimidinic endonuclease; HeLa, human cervical cancer cell line.