Figures & data
Figure 1 Chemical structure of PLB (5-hydroxy-2-methyl-1,4-naphthoquinone) and effect of PLB on cell viability in PC-3 and DU145 cells.
Abbreviation: IC50, half maximal inhibitory concentration; PLB, plumbagin; SD, standard deviation.
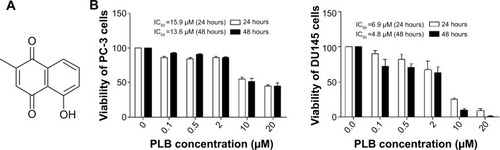
Table 1 Predicted protein targets of PLB
Table 2 Molecular interactions of PLB with selected potential target proteins
Figure 2 Molecular interactions between PLB and selected predicted targets.
Abbreviations: ABL1, c-Abl oncogene 1; ACPP, prostate acid phosphatase; ADH7, alcohol dehydrogenase 5; AKR1C1, aldo–keto reductase family 1, member C1; PDB, Protein Data Bank; PLB, plumbagin.
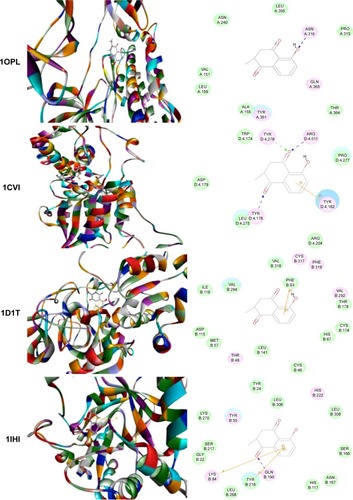
Figure 3 Molecular interactions between PLB and selected predicted targets.
Abbreviations: AKR1C3, aldo–keto reductase family 1, member C3; ALDH1L1, aldehyde dehydrogenase 1 family, member L1; ASS1, argininosuccinate synthase 1; AURKA, aurora kinase A; PDB, Protein Data Bank; PLB, plumbagin.
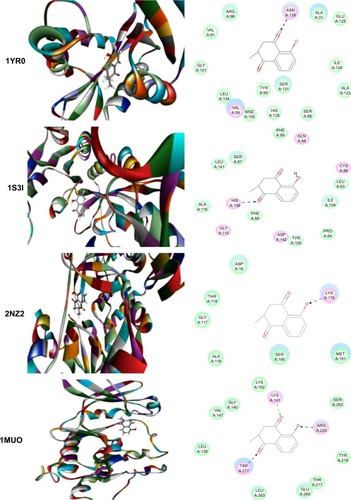
Figure 4 Molecular interactions between PLB and selected predicted targets.
Abbreviations: BCAT2, mitochondrial branched-chain amino-acid transaminase 2; CA4, carbonic anhydrase IV; CDKN2A, cyclin-dependent kinase inhibitor 2A; PDB, Protein Data Bank; PLB, plumbagin.
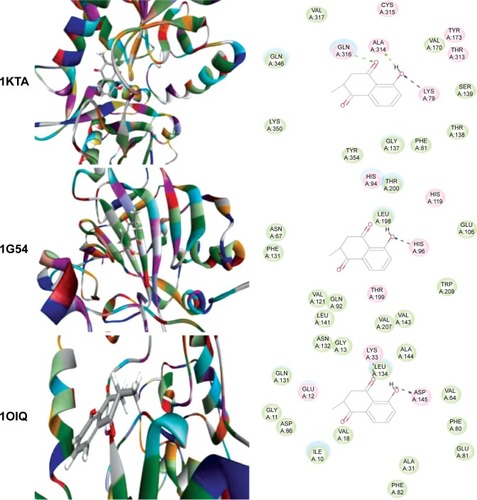
Figure 5 Molecular interactions between PLB and selected predicted targets.
Abbreviations: CLK1, CDC-like kinase 1; CRABP2, cellular retinoic acid binding protein 2; ESR1/NR3A1, estrogen receptor-α; PDB, Protein Data Bank; PLB, plumbagin.
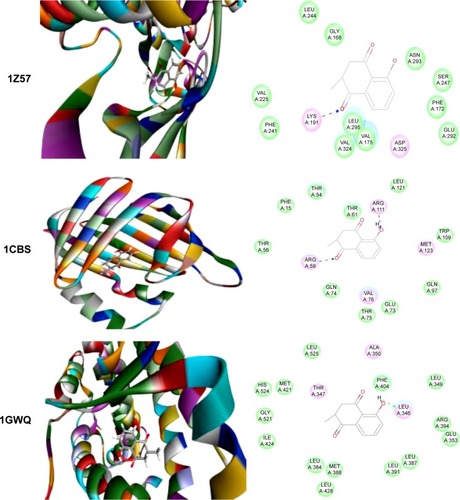
Table 3 The top enriched clusters (Enrich score >3) by the DAVID database for the target list of PLB derived from molecular docking calculations
Table 4 The top enriched KEGG pathways (FDR <0.1) by the DAVID database for the target list of PLB derived from molecular docking calculations
Table 5 Potential molecular targets, signaling pathways, and cellular functions regulated by PLB in PC-3 cells
Table 6 Potential molecular targets, signaling pathways, and cellular functions regulated by PLB in DU145 cells
Figure 6 Proteomic analysis revealed molecular interactome regulated by PLB in PC-3 cells.
Abbreviation: PLB, plumbagin.
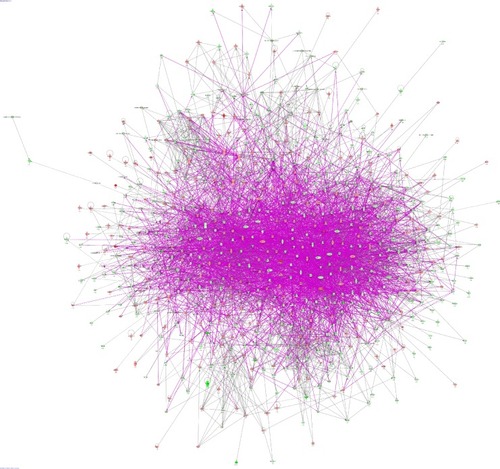
Figure 7 Proteomic analysis revealed molecular interactome regulated by PLB in DU145 cells.
Abbreviation: PLB, plumbagin.
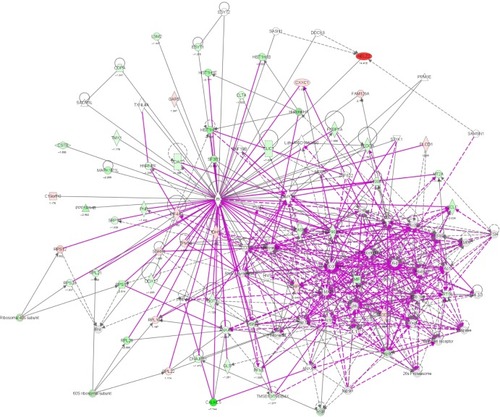
Figure 8 Proteomic analysis revealed a network of signaling pathways regulated by PLB in PC-3 cells.
Abbreviations: IPA, Ingenuity Pathway Analysis; PLB, plumbagin; TCA, tricarboxylic acid cycle.
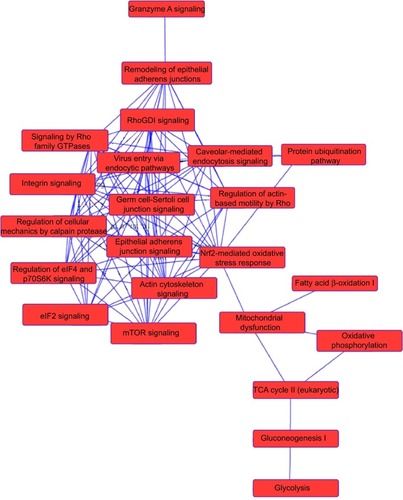
Figure 9 Proteomic analysis revealed networks of signaling pathways regulated by PLB in DU145 cells.
Abbreviations: cAMP, cyclic adenosine monophosphate; IPA, Ingenuity Pathway Analysis; PLB, plumbagin.
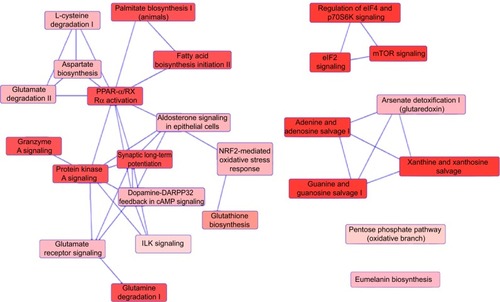
Figure 10 PLB regulates cell cycle at G2/M checkpoint in PC-3 cells.
Abbreviations: PLB, plumbagin; UV, ultraviolet.
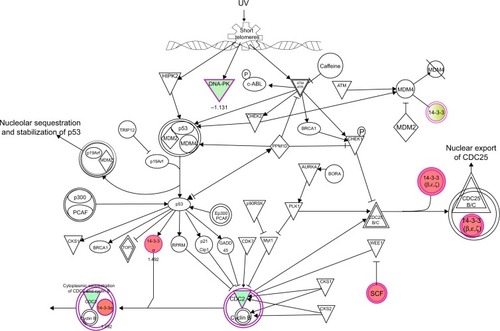
Figure 11 PLB regulates apoptosis signaling pathway in PC-3 cells.
Abbreviation: PLB, plumbagin.
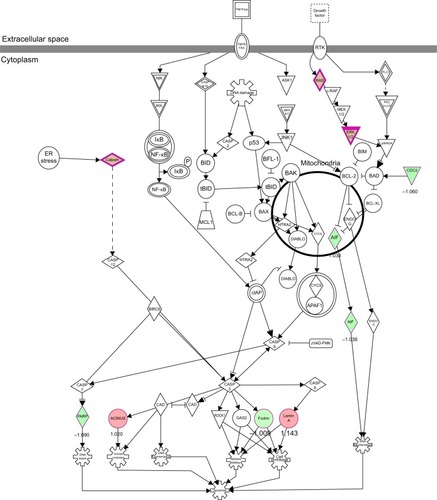
Figure 12 mTOR signaling pathway regulated by PLB in PC-3 cells.
Abbreviation: PLB, plumbagin.
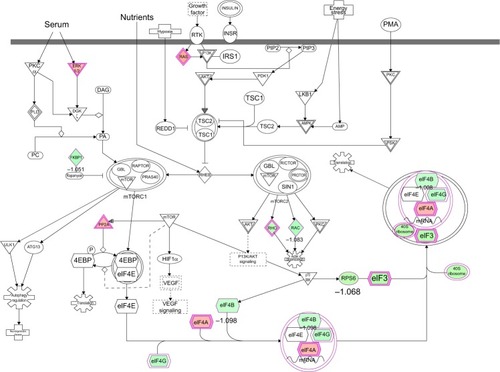
Figure 13 mTOR signaling pathway regulated by PLB in DU145 cells.
Abbreviation: PLB, plumbagin.
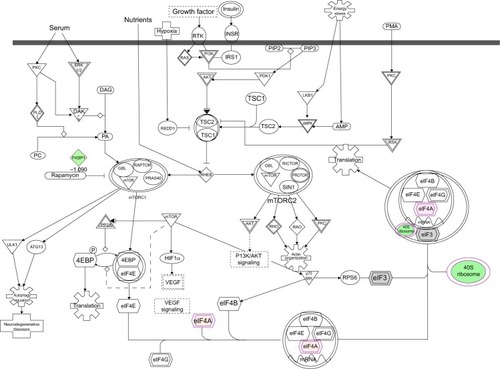
Figure 14 PLB regulates epithelial adherent junction signaling pathway in PC-3 cells.
Abbreviation: PLB, plumbagin.
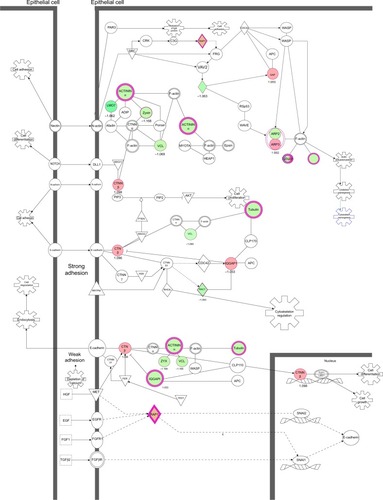
Figure 15 PLB-regulated Nrf2-mediated oxidative stress response in PC-3 cells.
Abbreviations: PLB, plumbagin; UV, ultraviolet.
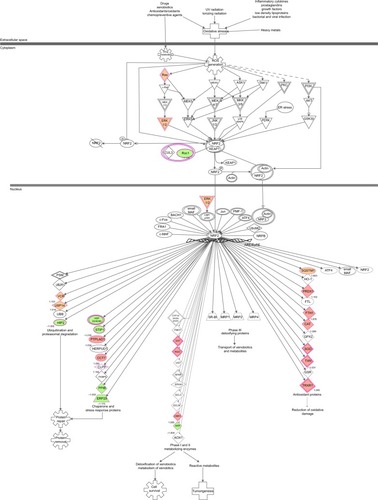
Figure 16 PLB-regulated Nrf2-mediated oxidative stress response in DU145 cells.
Abbreviations: PLB, plumbagin; UV, ultraviolet.
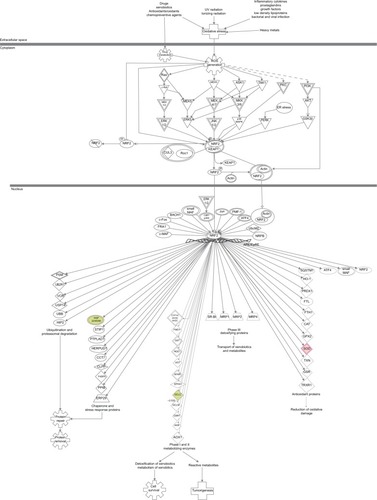
Table 7 Top five canonical pathways regulated by PLB in PC-3 cells
Table 8 Top five canonical pathways regulated by PLB in DU145 cells
Figure 17 PLB inhibits the proliferation of PC-3 and DU145 cells, and induces G2/M arrest in PC-3 cells and G1 arrest in DU145 cells.
Abbreviations: PI, propidium iodide; PLB, plumbagin.
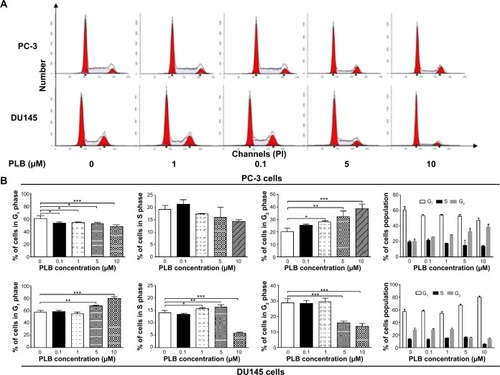
Figure 18 Inhibitory effect of PLB on the proliferation of PC-3 and DU145 cells over 72 hours.
Abbreviations: PI, propidium iodide; PLB, plumbagin.
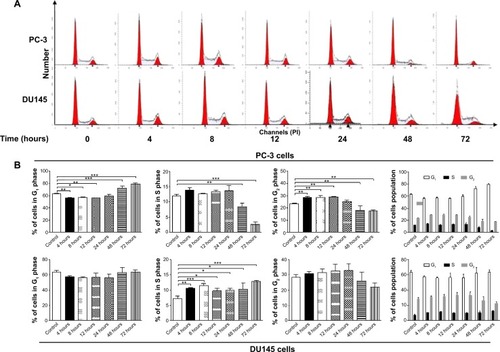
Figure 19 PLB regulates the expression of CDK1/CDC2, cyclin B1, CDK2, cyclin D1, p21 Waf1/Cip1, p27 Kip1, and p53 in PC-3 cells.
Abbreviation: PLB, plumbagin.
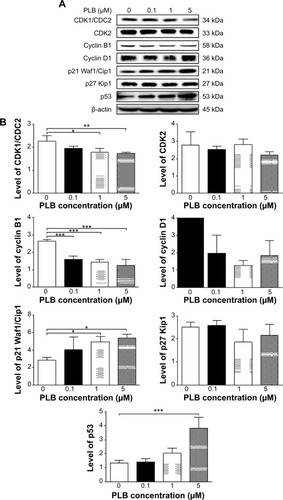
Figure 20 PLB regulates the expression of CDK1/CDC2, cyclin B1, CDK2, cyclin D1, p21 Waf1/Cip1, p27 Kip1, and p53 in DU145 cells.
Abbreviation: PLB, plumbagin.
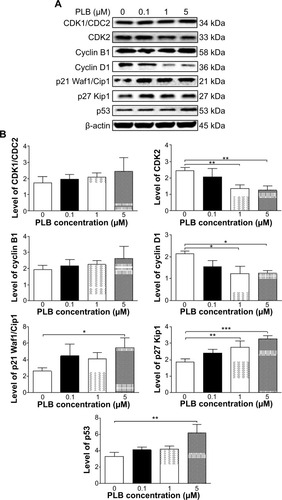
Figure 21 Effects of PLB treatment on the expression and phosphorylation levels of PI3K, Akt, mTOR, p38MAPK, and cytochrome c in PC-3 cells.
Abbreviation: PLB, plumbagin.
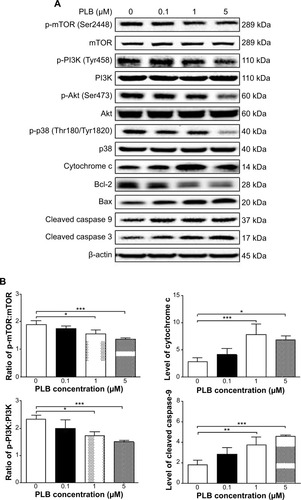
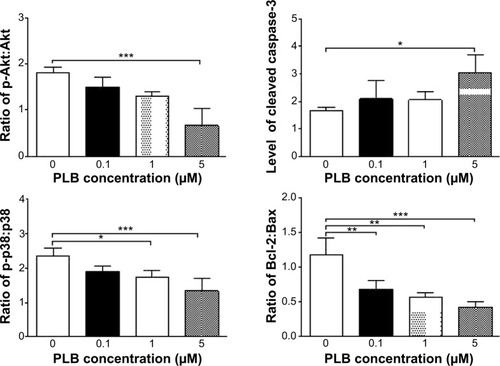
Figure 22 Effects of PLB treatment on the expression and phosphorylation levels of PI3K, Akt, mTOR, p38MAPK, and cytochrome c in DU145 cells.
Abbreviation: PLB, plumbagin.
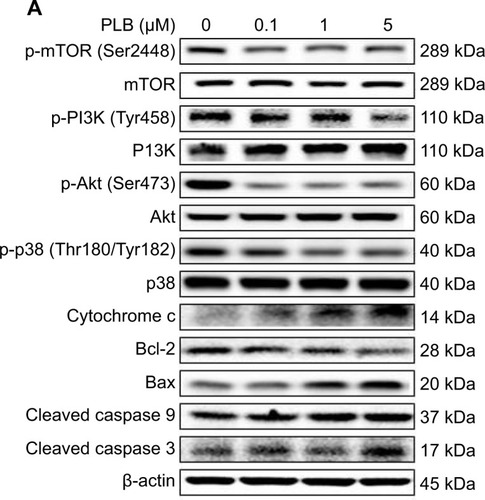
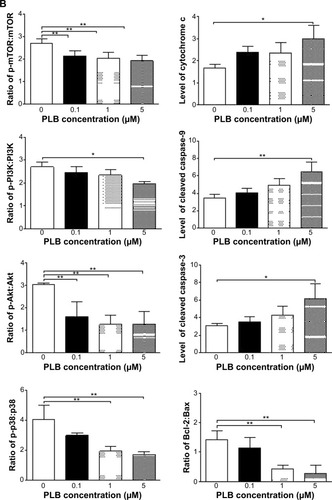
Figure 23 Dose effect of PLB on the expression level of selected EMT markers in PC-3 cells.
Abbreviations: EMT, epithelial–mesenchymal transition; PLB, plumbagin.
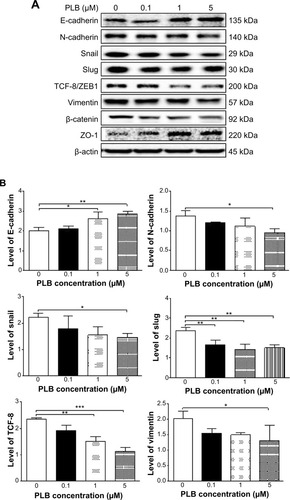
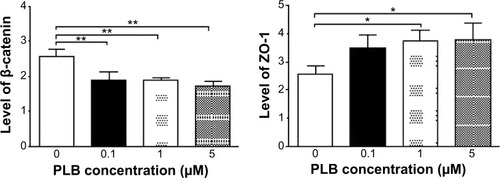
Figure 24 Dose-effect of PLB on the expression level of selected EMT markers in DU145 cells.
Abbreviations: EMT, epithelial–mesenchymal transition; PLB, plumbagin.
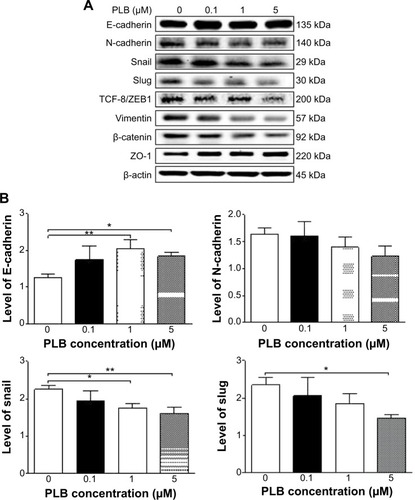
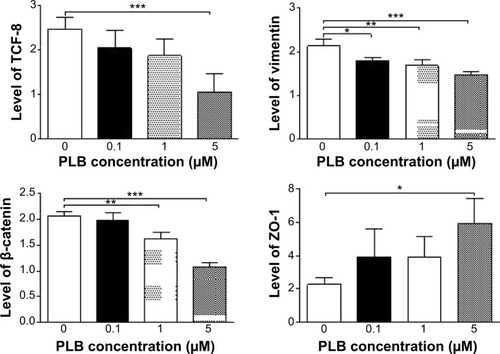
Figure 25 Effects of PLB on the expression level of selected EMT markers in PC-3 cells over 48 hours.
Abbreviations: EMT, epithelial–mesenchymal transition; PLB, plumbagin.
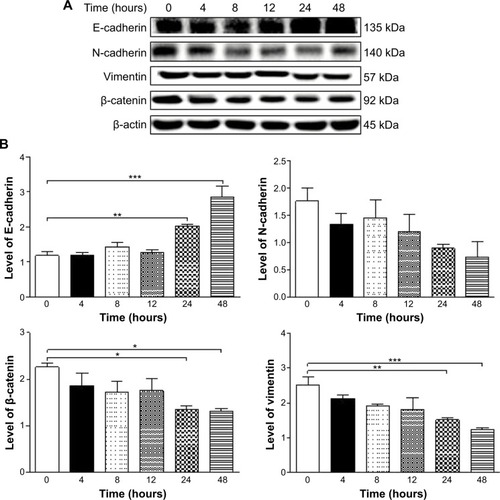
Figure 26 Effects of PLB on the expression level of selected EMT markers in DU145 cells over 48 hours.
Abbreviations: EMT, epithelial–mesenchymal transition; PLB, plumbagin.
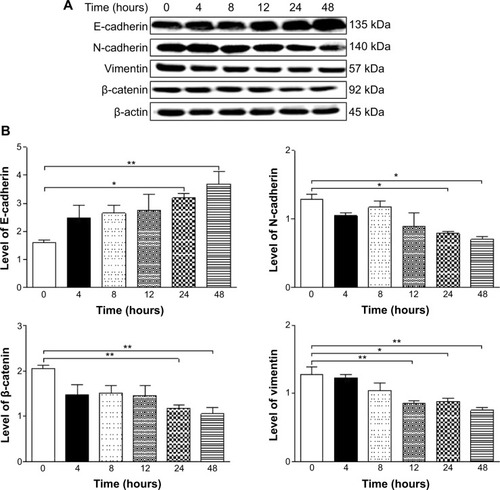
Figure 27 The role of Sirt-1 in PLB-induced EMT inhibition in PC-3 and DU145 cells.
Abbreviations: EMT, epithelial–mesenchymal transition; PLB, plumbagin; STL, sirtinol.
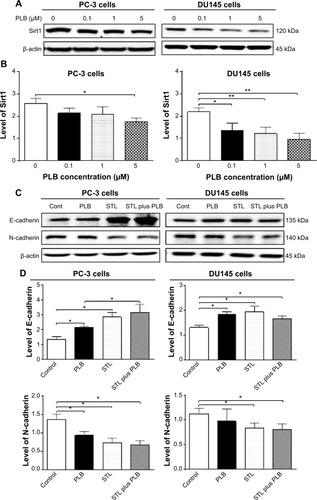
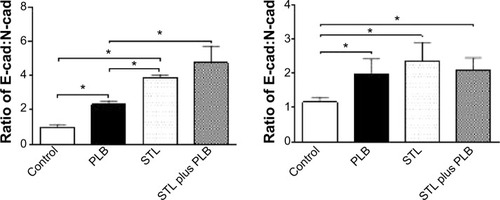
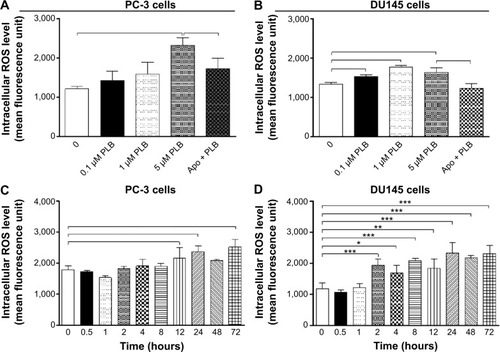
Figure 28 Effect of PLB on the intracellular ROS generation in PC-3 and DU145 cells.
Abbreviations: Apo, apocynin; PLB, plumbagin; ROS, reactive oxygen species.