
Figures & data
Table 1 Primer sequences, including forward (FW) and reverse (RV) sequences and optimal temperatures used for quantitative real-time polymerase chain reaction
Table 2 Blood and baseline parametersTable Footnotea
Table 3 Quantitative real-time polymerase chain-reaction results for different cytokines, chemokines, and transcription factors from the thoracic aortaTable Footnotea
Figure 1 No changes on plaque burden in plt/plt/Ldlr −/− mice.
Abbreviation: NS, not significant.
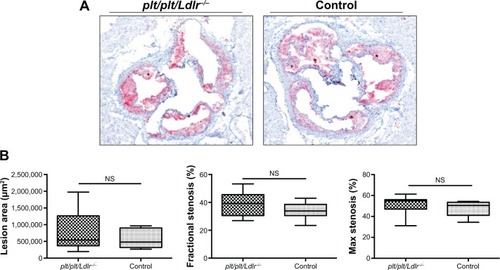
Figure 2 Higher plaque stability in plt/plt/Ldlr −/− mice.
Abbreviation: NS, not significant.
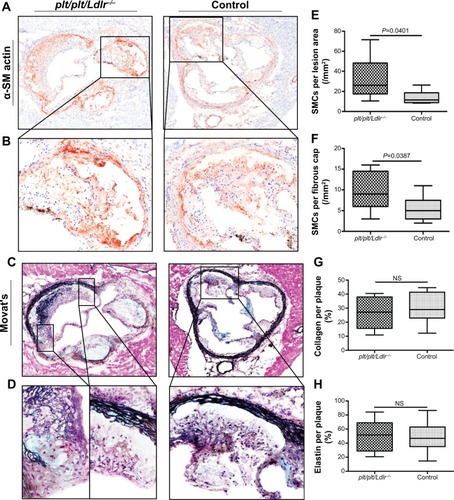
Figure 3 Increased lesional leukocyte infiltration in plt/plt/Ldlr −/− mice.
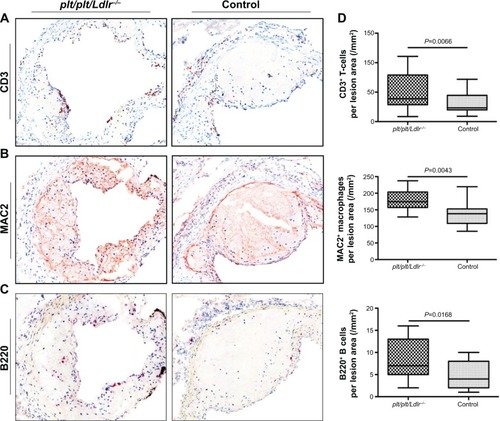
Table 4 Multiplex ELISA results for different cytokines and chemokines in blood serum of mice
Figure 4 CCL19 induces expression of Tnfa and Ifng in murine macrophages. RAW cells (murine macrophage cell line) were stimulated with either 100 ng CCL19 or 100 ng CCL21, and after 2 and 8 hours messenger ribonucleic acid levels of Tnfa (A, C) and Ifng (B, D) were measured by quantitative real-time polymerase chain-reaction analysis. Values are normalized to β-actin and expressed as complementary deoxyribonucleic acid (cDNA) copies/1,000 β-actin copies. Quantitative data of five independent experiments are presented in bar graphs ± standard deviation (A–D).
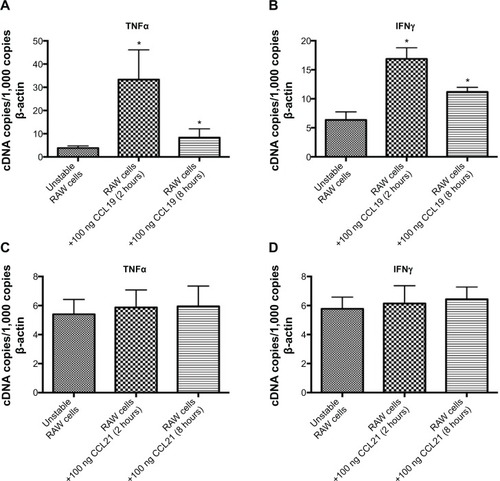
Table 5 Cellular composition of peripheral lymph nodes and spleenTable Footnotea
Figure 5 Lipid-loaded macrophages in atherosclerotic lesions and effects of CCL19 on oxidized low-density lipoprotein (oxLDL) uptake and foam-cell formation. Representative photomicrographs of immunohistochemistry stainings of macrophages (MAC2; brown staining) from aortic roots of plt/plt/Ldlr −/− mice (n=9) and control group (n=9) are shown at 4× magnification. Magnification (20×) shown below the images (black arrows point at macrophages) (A). Quantitative analysis of the size of lesional macrophages (μm2) is demonstrated. Results are presented as box plots displaying mean and 25th and 75th percentiles as boxes and 10th and 90th percentiles as whiskers (B). Effects of CCL19 on foam-cell formation (C, D). Representative Oil Red O staining of human monocyte-derived macrophages are shown. Groups: control (no oxLDL), oxLDL, and oxLDL plus CCL19 (C). Quantitative analysis of the Oil Red O-positive cell area/cell (oxLDL/cell [%]). Data are demonstrated as bar graphs ± standard deviation of five independent experiments (D). Quantitative analysis of five independent fluorescence-activated cell-sorting experiments for CD36 expression on the surface of human monocyte-derived macrophages after stimulation with 1,1′-dioctadecyl-3,3,3′3′-tetra-methylindocyanide percholorate (Dil)-labeled oxLDL or Dil-labeled oxLDL in addition to CCL19 or unstimulated macrophages (control). Data are presented as bar graphs ± standard deviation (E).
![Figure 5 Lipid-loaded macrophages in atherosclerotic lesions and effects of CCL19 on oxidized low-density lipoprotein (oxLDL) uptake and foam-cell formation. Representative photomicrographs of immunohistochemistry stainings of macrophages (MAC2; brown staining) from aortic roots of plt/plt/Ldlr −/− mice (n=9) and control group (n=9) are shown at 4× magnification. Magnification (20×) shown below the images (black arrows point at macrophages) (A). Quantitative analysis of the size of lesional macrophages (μm2) is demonstrated. Results are presented as box plots displaying mean and 25th and 75th percentiles as boxes and 10th and 90th percentiles as whiskers (B). Effects of CCL19 on foam-cell formation (C, D). Representative Oil Red O staining of human monocyte-derived macrophages are shown. Groups: control (no oxLDL), oxLDL, and oxLDL plus CCL19 (C). Quantitative analysis of the Oil Red O-positive cell area/cell (oxLDL/cell [%]). Data are demonstrated as bar graphs ± standard deviation of five independent experiments (D). Quantitative analysis of five independent fluorescence-activated cell-sorting experiments for CD36 expression on the surface of human monocyte-derived macrophages after stimulation with 1,1′-dioctadecyl-3,3,3′3′-tetra-methylindocyanide percholorate (Dil)-labeled oxLDL or Dil-labeled oxLDL in addition to CCL19 or unstimulated macrophages (control). Data are presented as bar graphs ± standard deviation (E).](/cms/asset/71d806b8-5da1-4fb3-98a0-e014a093fe14/dddt_a_72394_f0005_c.jpg)