Figures & data
Figure 1 Chromatograms of tramadol in plasma.
Notes: (A) Blank plasma; (B) standard plasma sample; (C) plasma sample after dosing. 1, Tramadol; 2, internal standard; 3, O-desmethyltramadol.
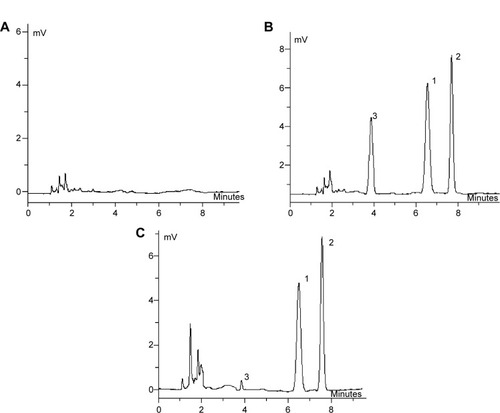
Figure 2 In vitro release profiles of tramadol from the test and reference (50 mg).
Notes: ⋄, Tablets; △, capsules. Release experiments were carried out in 0.1 M (HCL solution), at 37°C±0.5°C. Each point represents the mean value of six different experiments ± standard deviation.
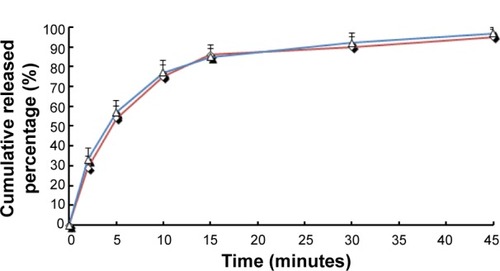
Table 1 Pharmacokinetic parameters of the two formulations
Table 2 Statistical comparison of the two formulations
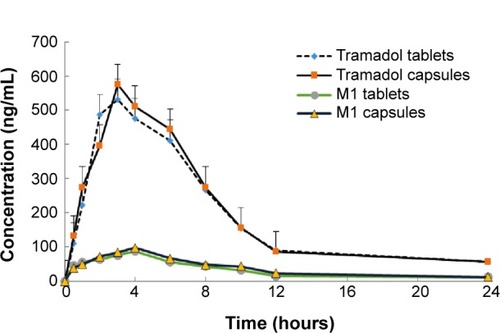
Figure 3 Mean plasma concentration–time profiles of tramadol from the test and reference in healthy male Chinese volunteers (50 mg).
Note: Each profile represents the mean ± standard deviation of ten volunteers.