
Figures & data
Table 1 Past medical history of the participants in two groups of the clinical trial comparing effect of flutamide and hydroquinone on melasma
Table 2 Mexameter melanin repeated measurements on various face spots compared for topical flutamide and hydroquinone over the treatment course
Figure 1 The trend of change in skin darkness and homogeneity scores compared for flutamide and hydroquinone randomized clinical trial groups.
Notes: (A) Skin darkness and (B) skin homogeneity trend. Measurement time points from baseline (1) to final measurement (5), 4 months after treatment. Skin darkness and homogeneity scores assessed by the physician (possible range: 0–4).
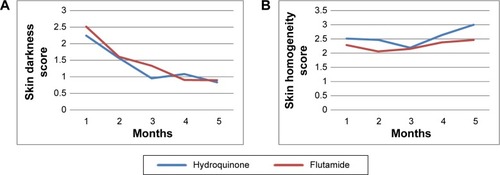
Figure 2 Box plot presenting the changes in MASI score over the time among patients treated either by topical flutamide or hydroquinone. *Indicates an outlier.
Abbreviation: MASI, Melasma Area and Severity Index.
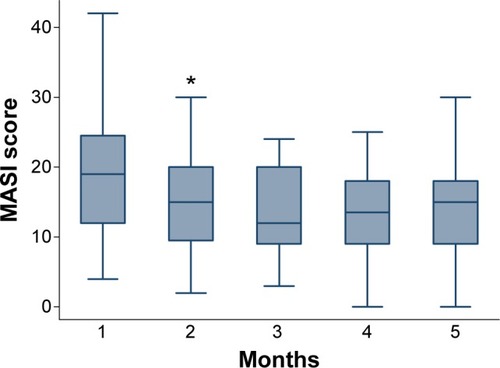
Table 3 Randomized clinical trials conducted to compare hydroquinone as the standard treatment with other topical alternative treatments