Figures & data
Figure 1 Reaction diagram of crosslink Tf.
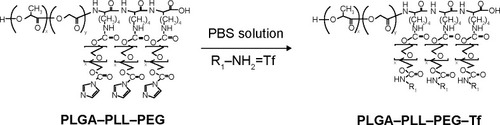
Figure 2 Structural model of Tf-modified copolymer drug-loaded NPs.
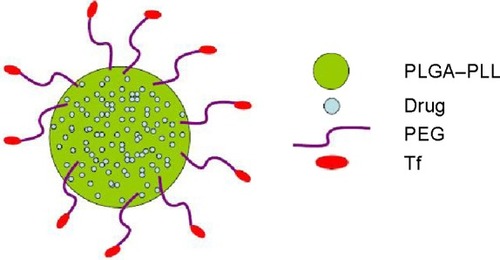
Figure 3 1H NMR spectrum.
Abbreviations: 1H NMR, proton nuclear magnetic resonance; PLL, poly-L-lysine; Cbz, carbobenzoxy; PLGA, poly(lactic-co-glycolic acid); CDI, N,N-carbony ldiimidazole; PEG, polyethylene glycol.
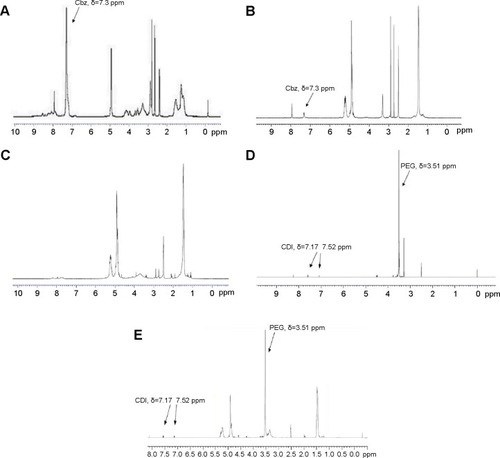
Figure 4 Effect of formulation parameters on the particle size and drug loadings of DNR and Tet in DNR/Tet–PLGA–PLL–PEG–Tf-NPs.
Abbreviations: DNR, daunorubicin; Tet, tetrandrine; PVA, polyvinyl alcohol; PLGA, poly(lactic-co-glycolic acid); PLL, poly-L-lysine; PEG, polyethylene glycol; Tf, transferrin; NPs, nanoparticles; Mw, molecular weight; A/D, acetone and dichloromethane; I/E, the internal aqueous phase to the external aqueous phase.
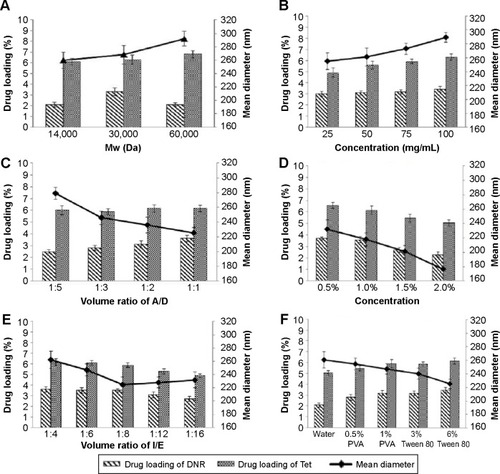
Figure 5 Effects of cryoprotectants on the mean diameter after freeze-drying.
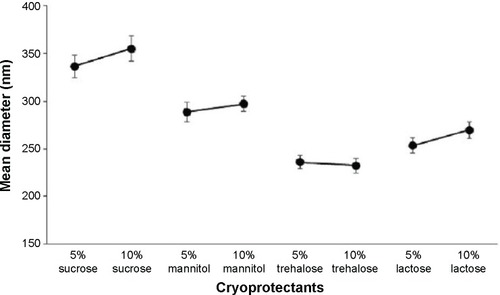
Figure 6 Gel permeation chromatography.
Abbreviations: min, minutes; Tf, transferrin; DNR, daunorubicin; Tet, tetrandrine; PLGA, poly(lactic-co-glycolic acid); PLL, poly-L-lysine; PEG, polyethylene glycol; NPs, nanoparticles.
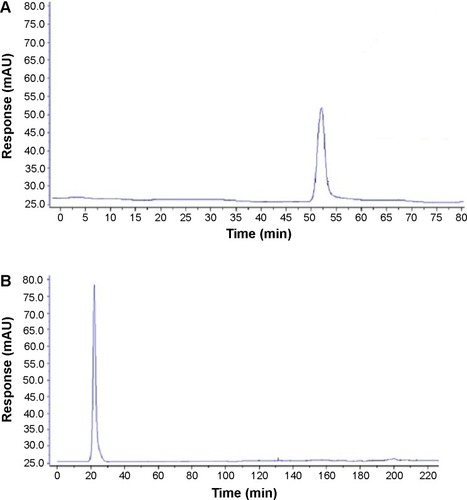
Figure 7 Solution color of DNR/Tet–PLGA–PLL–PEG–Tf-NPs (purple liquid) and DNR/Tet–PLGA–PLL–PEG-NPs (green liquid).
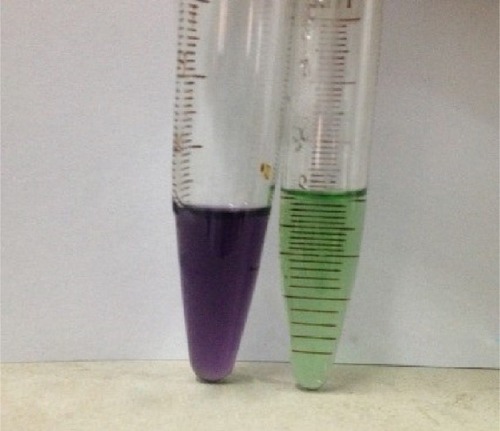
Figure 8 DNR/Tet–PLGA–PLL–PEG–Tf-NPs under TEM and histogram of particle size distribution.
Abbreviations: DNR, daunorubicin; Tet, tetrandrine; PLGA, poly(lactic-co-glycolic acid); PLL, poly-L-lysine; PEG, polyethylene glycol; Tf, transferrin; NPs, nanoparticles; TEM, transmission electron microscopy.
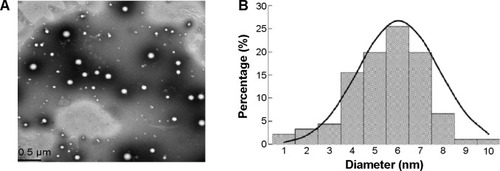
Figure 9 Particle size distribution of DNR/Tet–PLGA–PLL–PEG–Tf-NPs.
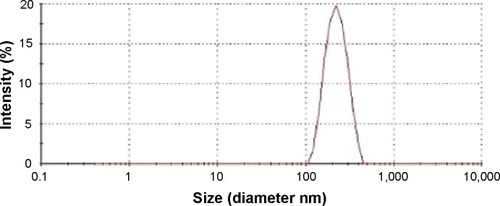
Figure 10 DSC thermography.
Abbreviations: DSC, differential scanning capacity thermography; exo, exothermic; Tet, tetrandrine; DNR, daunorubicin; PLGA, poly(lactic-co-glycolic acid); PLL, poly-L-lysine; PEG, polyethylene glycol; NPs, nanoparticles; Tf, transferrin.
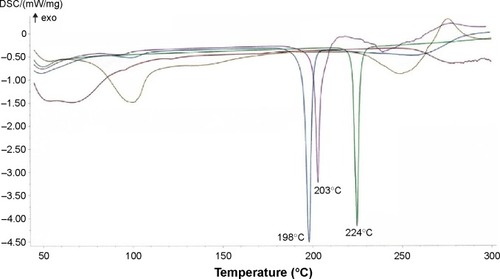
Figure 11 Release profiles of DNR and Tet from DNR/Tet–PLGA–PLL–PEG–Tf-NPs.
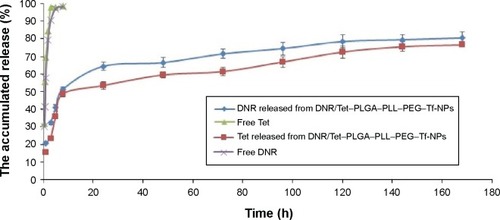
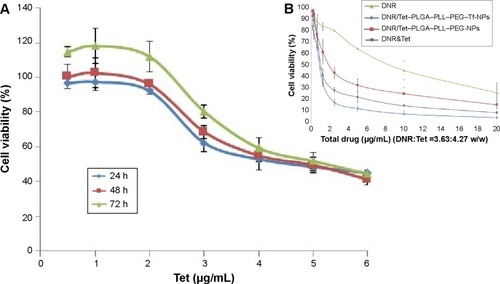
Figure 12 Cytotoxic effect of PLGA–PLL–PEG–Tf-NPs on K562/ADR cells for different times.
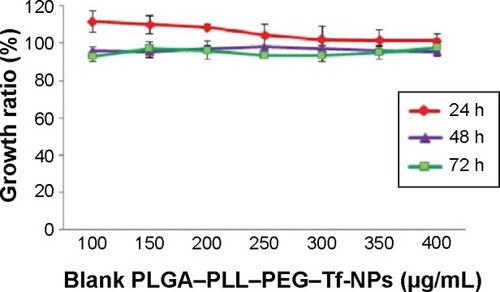
Figure 13 Cell viability of K562/ADR cells.
Abbreviations: DNR, daunorubicin; Tet, tetrandrine; PLGA, poly(lactic-co-glycolic acid); PLL, poly-L-lysine; PEG, polyethylene glycol; Tf, transferrin; NPs, nanoparticles; DNR&Tet, daunorubicin and tetrandrine; h, hours.