Figures & data
Figure 1 VA distribution.
Notes: Boxplots of VA (logMAR) mean values for each eye at the first and second visits.
Abbreviations: logMAR, log minimum angle of resolution; VA, visual acuity; VALE1 and 2, VA of left eye at first and second visits, respectively; VARE1 and 2, VA of right eye at first and second visits, respectively.
Abbreviations: logMAR, log minimum angle of resolution; VA, visual acuity; VALE1 and 2, VA of left eye at first and second visits, respectively; VARE1 and 2, VA of right eye at first and second visits, respectively.
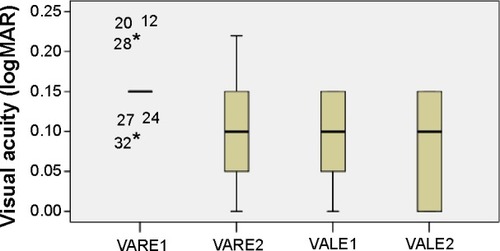
Figure 2 Retinal thickness distribution.
Notes: Boxplots of retinal thickness (in micrometers) mean values for each eye at the first and second visits.
Abbreviations: RTLE1 and 2, retinal thickness of left eye at first and second visits, respectively; RTRE1 and 2, retinal thickness of right eye at first and second visits, respectively.
Abbreviations: RTLE1 and 2, retinal thickness of left eye at first and second visits, respectively; RTRE1 and 2, retinal thickness of right eye at first and second visits, respectively.
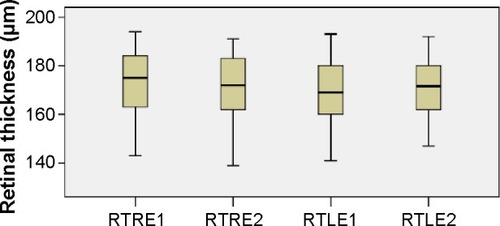
Table 1 Mean values and standard deviation of amplitudes (mf) and implicit time (T) of the central and peripheral responses at the first and second visits
Figure 3 Amplitudes of central responses.
Notes: Boxplots of central amplitudes (nV/deg2) mean values for each eye at the first and second visits.
Abbreviations: LE, left eye; RE, right eye; mf, multifocal electroretinography reading; mf1RE1, central area, right eye, first visit; mf1RE2, central area, right eye, second visit; mf1LE1, central area, left eye, first visit; mf1LE2, central area, left eye, second visit; nV/deg2, nanovolts per degree squared.
Abbreviations: LE, left eye; RE, right eye; mf, multifocal electroretinography reading; mf1RE1, central area, right eye, first visit; mf1RE2, central area, right eye, second visit; mf1LE1, central area, left eye, first visit; mf1LE2, central area, left eye, second visit; nV/deg2, nanovolts per degree squared.
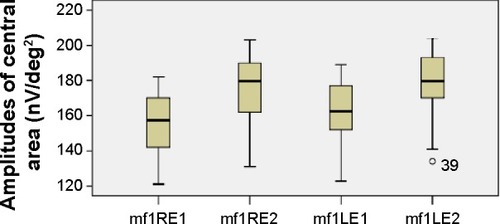
Figure 4 Amplitudes of peripheral responses.
Notes: Boxplots of peripheral amplitude (nV/deg2) mean values for each eye at the first and second visits.
Abbreviations: LE, left eye; RE, right eye; mf, multifocal electroretinography reading; mf2RE1, peripheral area, right eye, first visit; mf2RE2, peripheral area, right eye, second visit; mf2LE1, peripheral area, left eye, first visit; mf2LE2, peripheral area, left eye, second visit; nV/deg2, nanovolts per degree squared.
Abbreviations: LE, left eye; RE, right eye; mf, multifocal electroretinography reading; mf2RE1, peripheral area, right eye, first visit; mf2RE2, peripheral area, right eye, second visit; mf2LE1, peripheral area, left eye, first visit; mf2LE2, peripheral area, left eye, second visit; nV/deg2, nanovolts per degree squared.
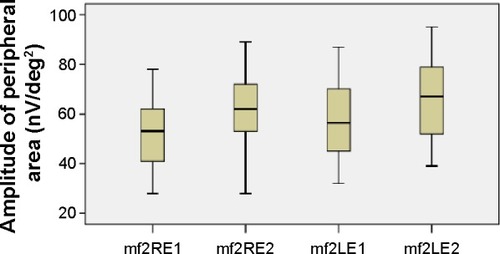
Figure 5 Implicit times of central responses.
Notes: Boxplots of central implicit time (ms) mean values for each eye at the first and second visits.
Abbreviations: LE, left eye; RE, right eye; T1, time 1; T1LE1, central area, left eye, first visit; T1LE2, central area, left eye, second visit; T1RE1, central area, right eye, first visit; T1RE2, central area, right eye, second visit.
Abbreviations: LE, left eye; RE, right eye; T1, time 1; T1LE1, central area, left eye, first visit; T1LE2, central area, left eye, second visit; T1RE1, central area, right eye, first visit; T1RE2, central area, right eye, second visit.
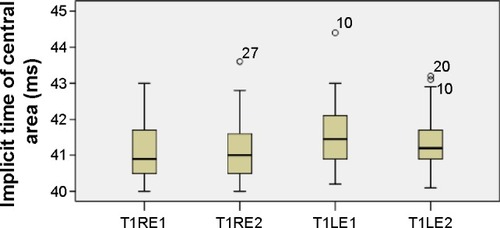
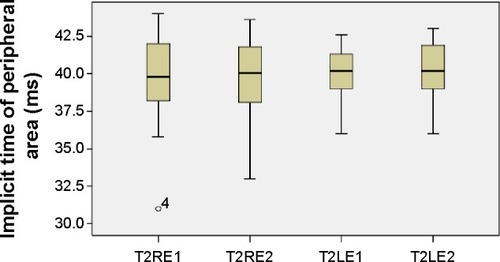
Figure 6 Implicit times of peripheral responses.
Notes: Boxplots of peripheral implicit time (ms) mean values for each eye at the first and second visits.
Abbreviations: LE, left eye; RE, right eye; T2LE1, peripheral area, left eye, first visit; T2LE2, peripheral area, left eye, second visit; T2RE1, peripheral area, right eye, first visit; T2RE2, peripheral area, right eye, second visit.
Abbreviations: LE, left eye; RE, right eye; T2LE1, peripheral area, left eye, first visit; T2LE2, peripheral area, left eye, second visit; T2RE1, peripheral area, right eye, first visit; T2RE2, peripheral area, right eye, second visit.