
Figures & data
Table 1 Pharmacokinetics of single ascending doses of lesinurad in healthy fasted and fed male subjects
Figure 1 Plasma lesinurad concentration profiles. (A) and median percent change from baseline in serum uric acid profiles following single doses of lesinurad in healthy male subjects (B).
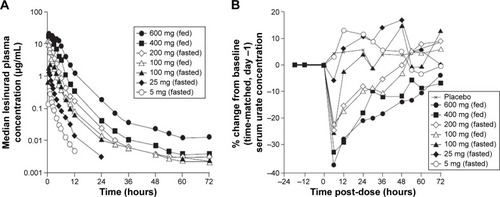
Table 2 Pharmacokinetics and pharmacodynamics of multiple ascending doses of lesinurad in healthy fed and fasting male subjects
Figure 2 Median percent changes from baseline (time-matched, day −1) serum concentrations of urate following once-daily oral doses of lesinurad for 10 days.
Abbreviation: IR, immediate release.
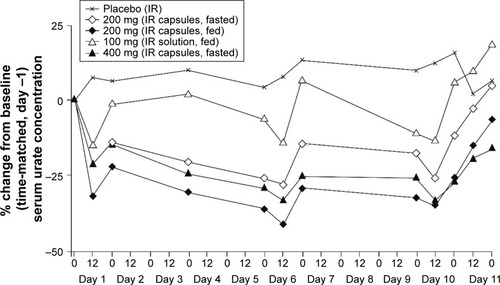
Figure 3 Median plasma concentration profiles from 0 to 24 hours post-dose following single doses of lesinurad: tablet versus capsule in healthy fed male subjects.
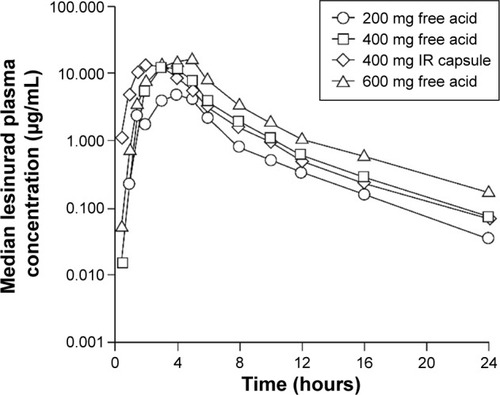
Figure 4 Dose linearity and proportionality of lesinurad under fasted (5–400 mg) or fed (100–600 mg) conditions in healthy subjects (A), and correlation between plasma lesinurad exposure or amount excreted in urine and serum uric acid-lowering effect (B).
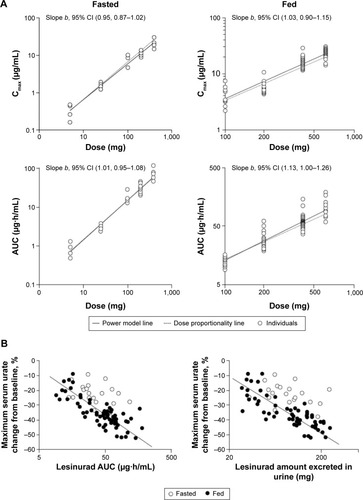
Table S1 Demographic and baseline characteristics of study subjects
Table S2 Plasma and urinary pharmacokinetics of lesinurad following single doses of lesinurad in healthy fed male subjects – tablet versus capsule (bioavailability study)
Table S3 AEs in MAD occurring in one or more subjects receiving lesinurad