Figures & data
Table 1 OSDI scores, clinical grading scores, and percentage of bulbar conjunctival vascularization area in the treatment (subconjunctival bevacizumab) of eyes at all visits compared with the baseline
Table 2 Conjunctival goblet cell density in the treatment (subconjunctival bevacizumab) of eyes at 1 mo and 3 mos after injection compared with the baseline
Figure 1 Bulbar conjunctival vascularization area.
Notes: The upper row images are the conjunctival vascularization pictures obtained with an IM900 slit lamp. The lower row images are the correspondent vascular pictures analyzed with Image J software. (A) is at 3 days before injection. High vascular density with a wide diameter could be observed. (B) refers to 1 week after injection. (C) is at 1 month after injection. (D) is at 3 months after injection. The vasculars in (B–D) are much thinner in diameter with lower density. All the dark pixels resulted from the light reflection were excluded from calculation. The pixels of the eyelid and eyelash were excluded.
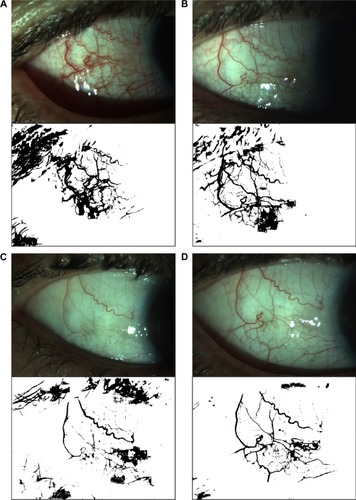
Figure 2 Conjunctival cytology analysis (stained with periodic acid–Schiff, 40×).
Notes: (A) refers to the staining before injection. (B) represents the staining 1 month after injection. (C) is the staining 3 months after injection. Compared to (A), the epithelial in (B) and (C) is more regular, rounder and smaller, the cell gap in (B) and (C) is much closer. The density of goblet cell, is much higher in (B) and (C), compared to (A).
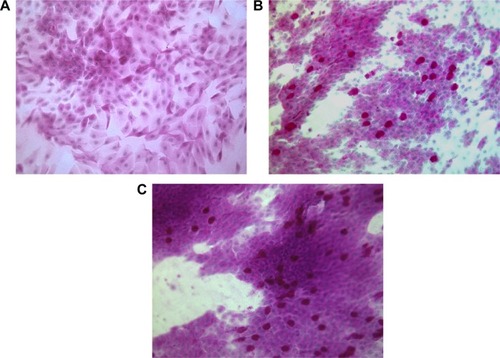
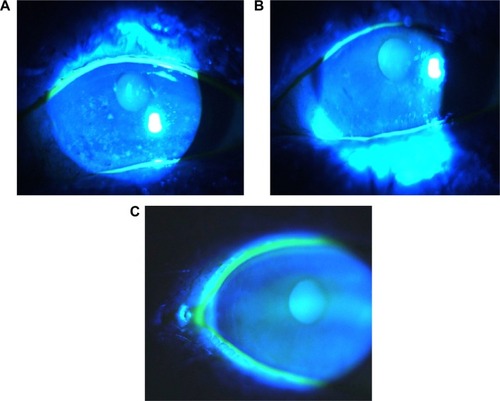
Figure 3 Corneal staining pictures
Notes: (A) refers to the staining picture obtained before injection. (B) represents the staining picture obtained 1 month after injection. (C) is the staining picture taken 3 months after injection. A dramatic improvement in corneal staining could be observed in (B) and (C), compared to (A).