Figures & data
Figure 1 Scanning electron micrograph of RGD-ACM liposomes.
Abbreviations: ACM, aclacinomycin A; RGD, arginine-glycine-aspartic acid.
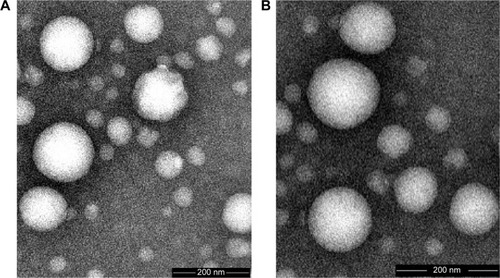
Figure 2 In vitro release of ACM-loaded liposomes in phosphate-buffered saline (pH 7.4, n=3).
Abbreviations: ACM, aclacinomycin A; RGD, arginine-glycine-aspartic acid.
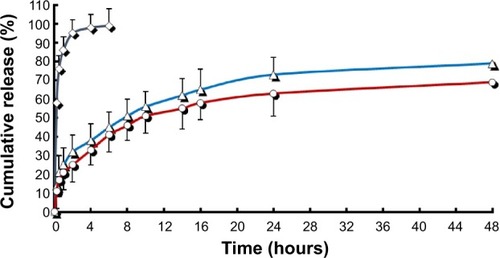
Figure 3 The sample did not aggregate and still had the appearance of a milky white colloidal solution after being dissolved in phosphate-buffered saline (pH 7.4) and kept at 4°C for (A) one month and (B) two months.
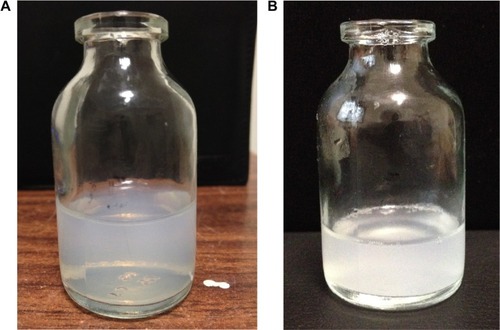
Table 1 Pharmacokinetic parameters of the two formulations
Figure 4 Mean plasma ACM concentration in rats after intravenous administration (8 mg/kg) of the two formulations (n=6). The blue line indicates RGD-ACM liposomes and the red line indicates ACM liposomes.
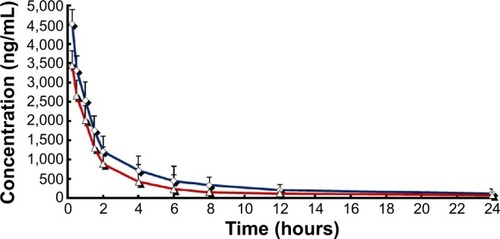
Table 2 Effect of RGD-ACM liposomes and ACM liposomes on A549 cells in nude mice
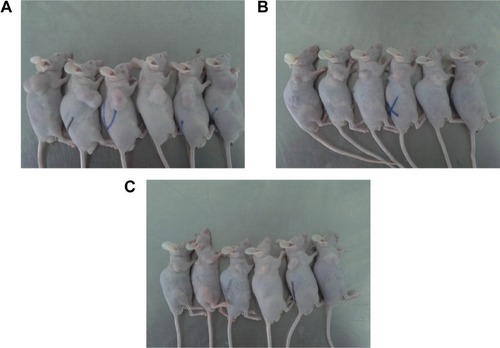
Figure 5 Changes in tumor volume in nude mice transplanted with a human adenocarcinoma (A549) cell line on day 10.
Abbreviations: ACM, aclacinomycin A; RGD, arginine-glycine-aspartic acid.