
Figures & data
Table 1 Summary of pharmacokinetic results for naproxen and esomeprazole
Figure 1 Mean plasma concentration–time profiles of naproxen and esomeprazole.
Notes: (A) Mean plasma concentration–time profiles of naproxen after a single dose of HCP1004 or VIMOVO®, and (B) mean plasma concentration–time profiles of esomeprazole after a single dose of HCP1004 or VIMOVO®.
Abbreviations: N, number of subjects; hr, hours.
Abbreviations: N, number of subjects; hr, hours.
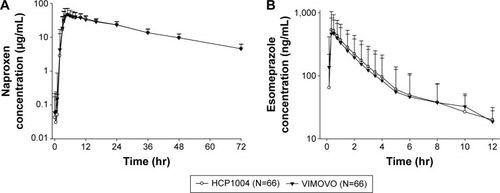
Figure 2 Individual changes in pharmacokinetic parameters.
Notes: (A) Cmax of naproxen; (B) AUC0−t of naproxen; (C) Cmax of esomeprazole; and (D) AUC0−t of esomeprazole.
Abbreviations: Cmax, maximum plasma concentration; AUC0−t, area under the concentration–time curve from time 0 to the last measurable time point.
Abbreviations: Cmax, maximum plasma concentration; AUC0−t, area under the concentration–time curve from time 0 to the last measurable time point.
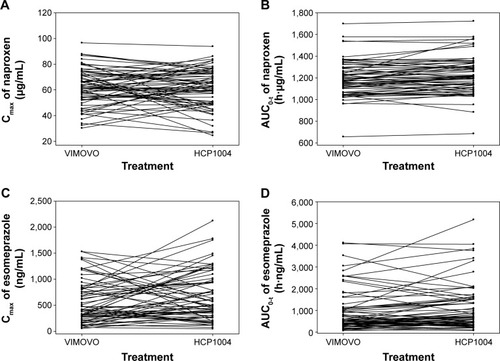
Table 2 Pharmacokinetic comparison of naproxen and esomeprazole by treatment
Table 3 Incidence of AEs after a single dose of HCP1004 or VIMOVO®
Table S1 Comparison of AEs by treatment group