
Figures & data
Figure 1 Uric acid formation.
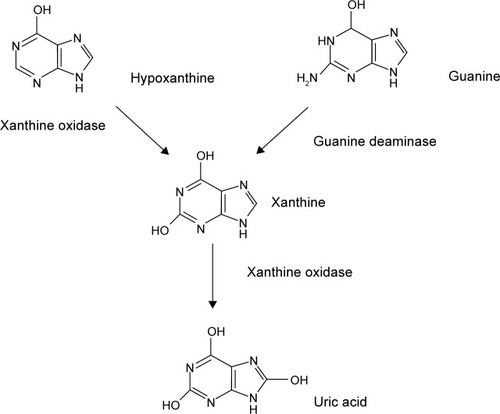
Table 1 Summary of pharmacodynamic parameters for uric acid
Figure 2 Uric acid–time profile after administration of LC350189.
Abbreviations: SAD, single ascending dose; MAD, multiple ascending dose; h, hours.
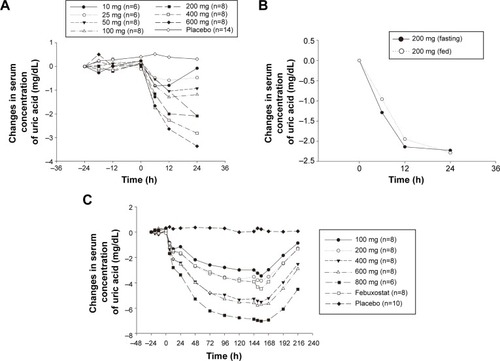
Figure 3 The box plots of the mean percentage changes in serum 24-hour mean concentration (Cmean,24) (A, C, and E) and the amount of uric acid, xanthine, and hypoxanthine excreted in urine (B, D, and F) vs dose following a single-dose (day 1) administration of LC350189.
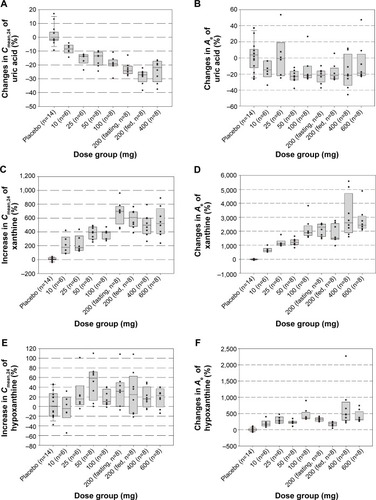
Figure 4 The box plots of the mean percentage changes in serum 24-hour mean concentration (Cmean,24) (A, C, and E) and the amount of uric acid, xanthine, and hypoxanthine excreted in urine (B, D, and F) vs dose following multiple-dose (day 7) administrations of LC350189 or febuxostat.
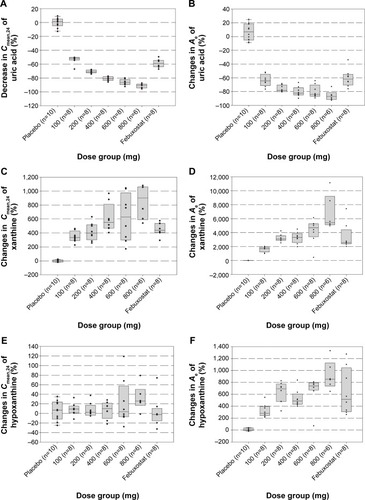
Table 2 Summary of pharmacodynamic parameters for xanthine
Table 3 Summary of pharmacodynamic parameters for hypoxanthine
Table 4 Summary of pharmacokinetic parameters for LC350189 in the single ascending dose study
Table 5 Summary of plasma pharmacokinetic parameters for LC350189 in the multiple ascending dose study
Figure 5 Mean plasma concentration–time curves following single oral administration of LC350189.
Abbreviation: h, hours.
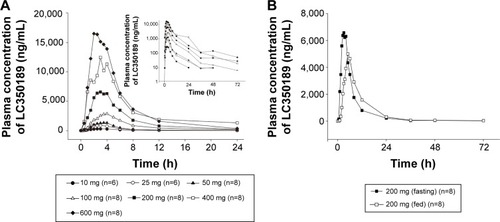
Figure 6 Mean plasma concentration–time curves following once-daily oral administration of LC350189 for 7 days.
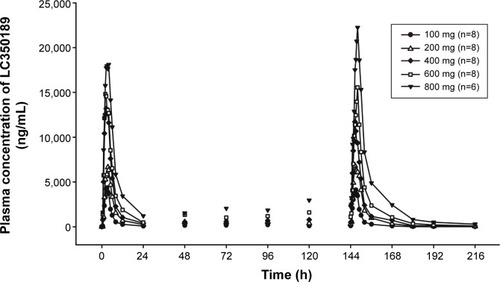
Figure 7 The relationship between the percentage decrease in 24-hour mean concentration (Cmean,24) of serum uric acid and the area under the plasma concentration–time curve of LC350189 (AUCtau,ss) on day 7 following multiple-dose administration with LC350189.
Abbreviation: hr, hours.
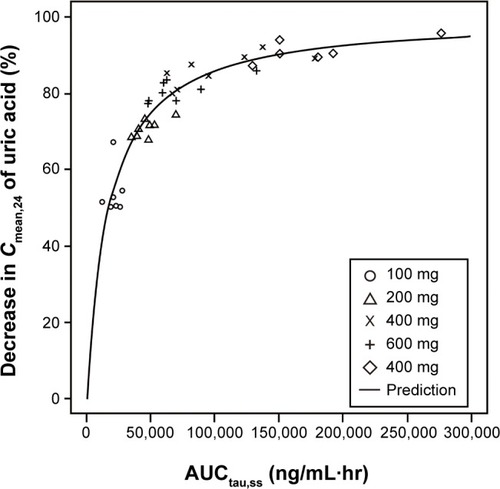
Table 6 Summary of adverse events
Table S1 Sampling procedures for PK and PD analysis and sample handling process
Table S2 Amount of uric acid, xanthine, and hypoxanthine excreted in urine