Figures & data
Figure 1 Therapeutic design of PLGA-OP cylindrical implants.
Abbreviations: OP, oseltamivir phosphate; PLGA, poly (lactic-co-glycolic acid); SEM, scanning electron microscope.
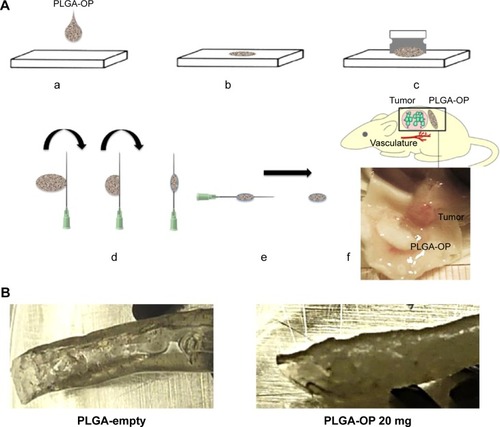
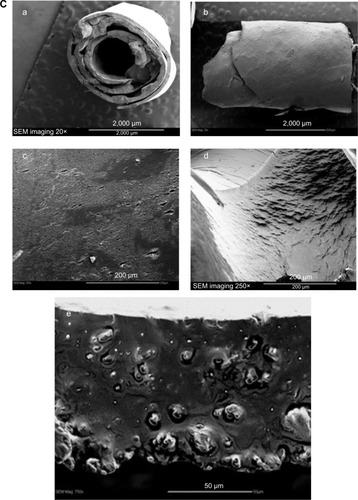
Figure 2 (A) A thermogram showing the glass transition temperatures of (a) PLGA polymer (32.7°C), PLGA loaded with (b) 20 mg (32.8°C), (c), 10 mg (15.2°C), and (d) 0 mg OP (5.8°C). (B) Cumulative release kinetics for PLGA blank, 10 mg and 20 mg OP loaded PLGA. All PLGA-OP samples exhibited a biphasic release profile.
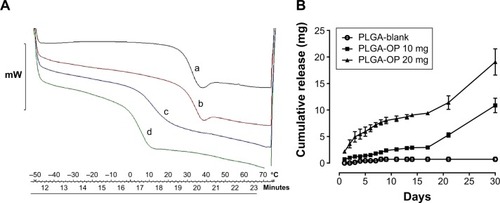
Figure 3 (A) PLGA-OP treatment of RAGxCγ double mutant mice bearing heterotopic xenografts of pancreatic PANC1 tumors. Cells at 0.5×10⁶ in 0.2 mL were implanted subcutaneously in the right back flank of these mice. Twice a week following implantation of the PANC1 cancer cells, each mouse was monitored for tumor volume ((width squared/2) × length) at the site of implantation. Mice were surgically implanted with sterilized PLGA-empty (four mice) and PLGA-OP (four mice cylinders) containing 20 mg OP at day 35 post-implantation of cancer cells when the tumor volume reached approximately 50–120 mm3. (B) Graph of mean ± SEM of live necropsy tumor weight per mouse body weight. Statistical analysis using unpaired t-test was carried out using GraphPad Prism, and the results were compared with untreated control cohort.
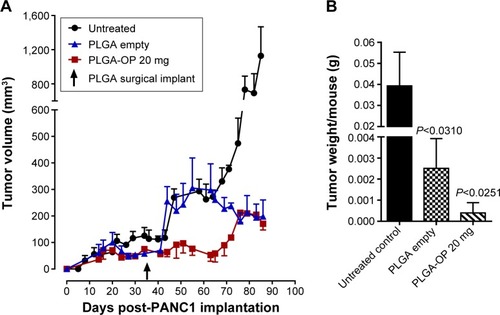
Abbreviations: OP, oseltamivir phosphate; PLGA, poly (lactic-co-glycolic acid); SEM, standard error of the mean.
Figure 5 Blank PLGA cylinders in culture with PANC1 cells. Morphology of viable cells at 3, 6, 10, and 15 days. Viability of cells was counted using 0.4% trypan blue solution and hemacytometer. Cell count was expressed as a percentage of control.
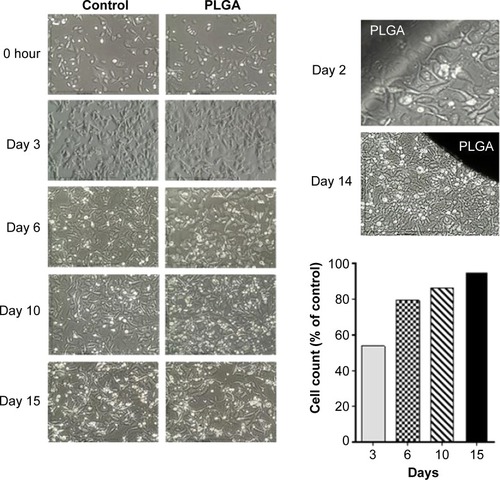
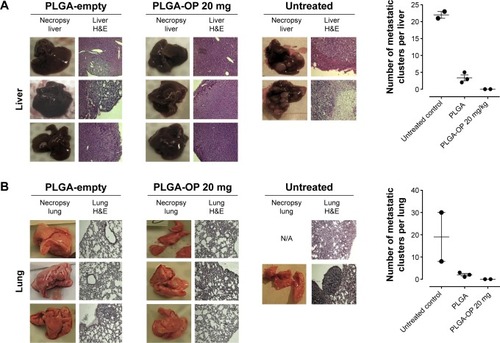
Figure 6 Necropsy liver (A) and lung (B). RAGxCγ double mutant mice were implanted with 0.5×10⁶ PANC1 pancreatic cancer cells subcutaneously on the rear flank and PLGA-empty and PLGA-OP 20 mg cylinders were surgically implanted at day 35 post-implantation when tumors reached 100–120 mm3. Paraffin-embedded tissue sections (5 μm) on glass slides were processed for HE staining for each mouse necropsied at end point of the study. Stained tissue sections were photographed using a Zeiss Imager M2 fluorescence microscope at 400× magnification. Images are representative of at least five fields of view from two tissue sections. Metastatic tissue clusters were microscopically counted per tissue sections (5 μm) and plotted in the graph.